H-Index Distributions in Biology
The h-index is a widely accepted metric of research productivity and scientific impact, developed by Jorge E Hirsch in 2005. It is commonly referenced in hiring and promotion decisions, taking into account the number of publications that an author has and the number of citations each paper received. The controversies surrounding h-index have led to the development of alternative metrics; however, it remains the most widely used. One criticism is that it can vary widely between disciplines and even subdisciplines of academic science due to differences in publishing frequency. Curious about its use in the promotion and hire of biologists who make heavy use of computational biology in their work, we examined the h-indices of more than 300 professors from 16 academic institutions.
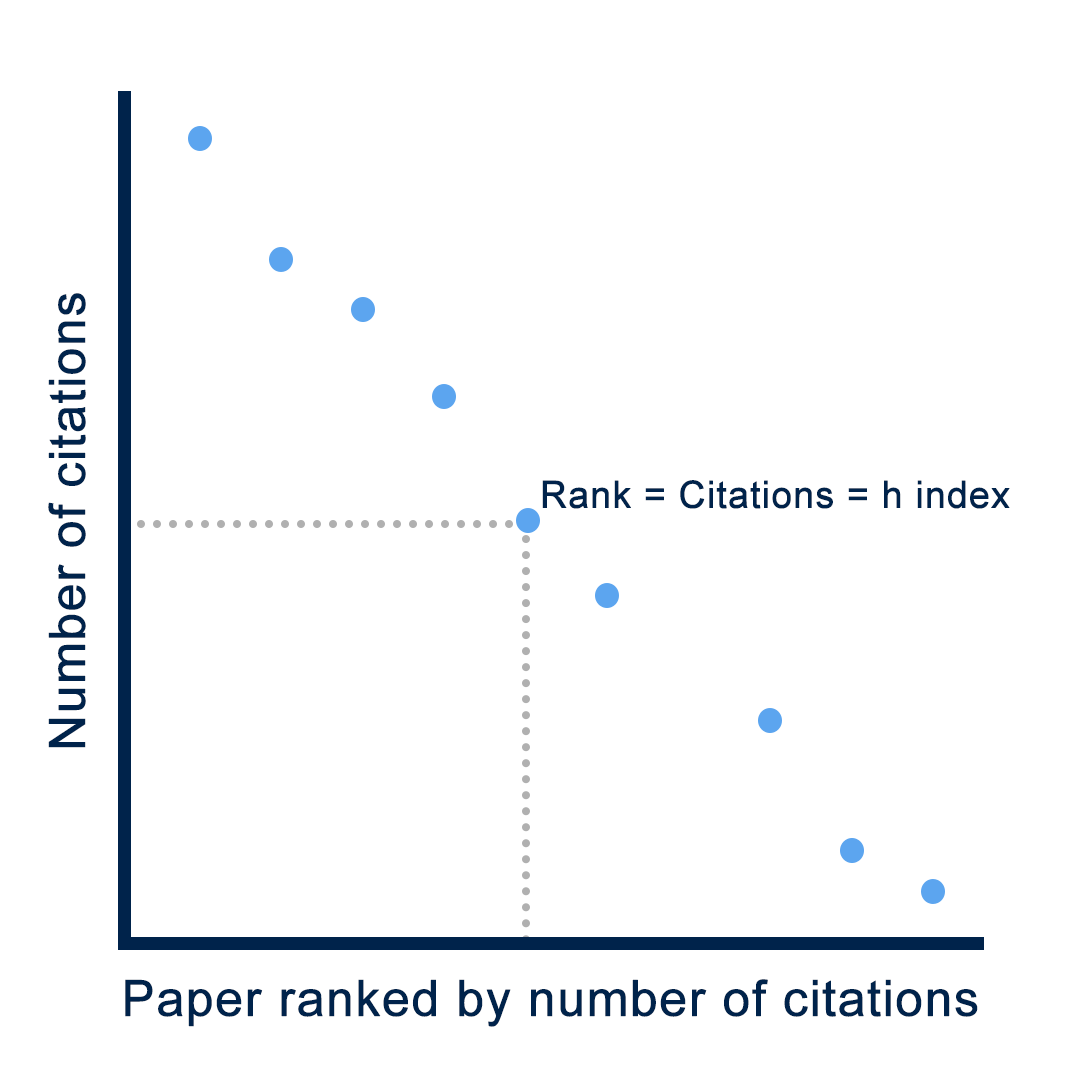
How to Calculate H-index
Start by listing your papers in order from most citations to least. The paper with the most citations has a rank of 1. Count down from the top of the list checking to see if the rank of the paper is less than the number of citations. Once you get to the point where the paper’s rank is greater than or equal to the number of citations it has, you have found the h-index.
Methods
We selected 16 biology programs (see table) in the United States from the QS World University Rankings database and organized the list by the university’s h-index. Universities in group 1 were ranked at the top of the list, group 2 around the median, and group 3 from the bottom of the list.
It should be noted that a low rank does not equate to a low quality program. Inclusion on this list means that the institution is among the best 500 universities in the world, and all but one of these universities is R1 by the Carnegie classification.
We identified tenure-track faculty who make use of computational biology at each university. Many universities do not have a bioinformatics or quantitative biology department, so these faculty were found in a variety of departments such as mathematics, biology, chemistry, and computer science.
Using the Web of Science database, we calculated the h-index for each scientist in the year they began working at a given academic level (i.e. assistant professor, associate professor, or full professor).
| QS World University Rank | University | H-index group |
| 1 | Harvard University | Group 1 |
| 2 | Massachusetts Institute of Technology | Group 1 |
| 3 | Stanford University | Group 1 |
| 150 | University of Alabama at Birmingham | Group 2 |
| 153 | Brown University | Group 2 |
| 155 | University of Tennessee at Knoxville | Group 2 |
| 156 | University of Illinois at Chicago | Group 2 |
| 160 | University at Buffalo SUNY | Group 2 |
| 351 | University of Oregon | Group 3 |
| 351 | Oregon State University | Group 3 |
| 356 | Loyola University Chicago | Group 3 |
| 356 | Brandeis University | Group 3 |
| 362 | University of South Carolina at Columbia | Group 3 |
| 376 | Kansas State University | Group 3 |
| 449 | Boston College | Group 3 |
| 474 | Texas Tech | Group 3 |
Results
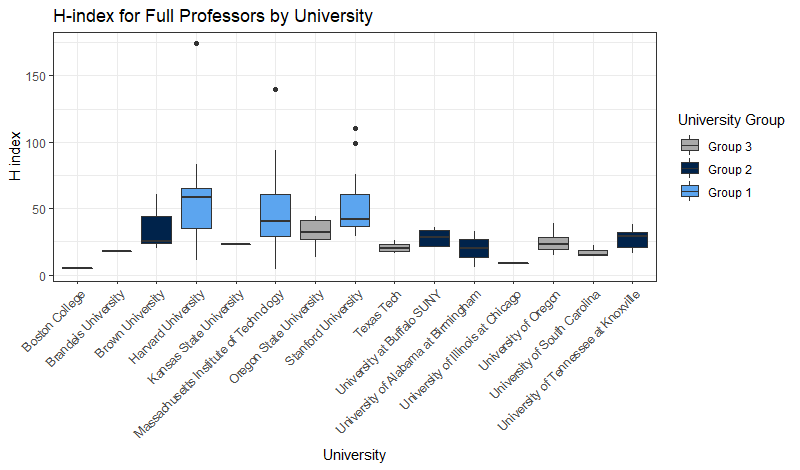
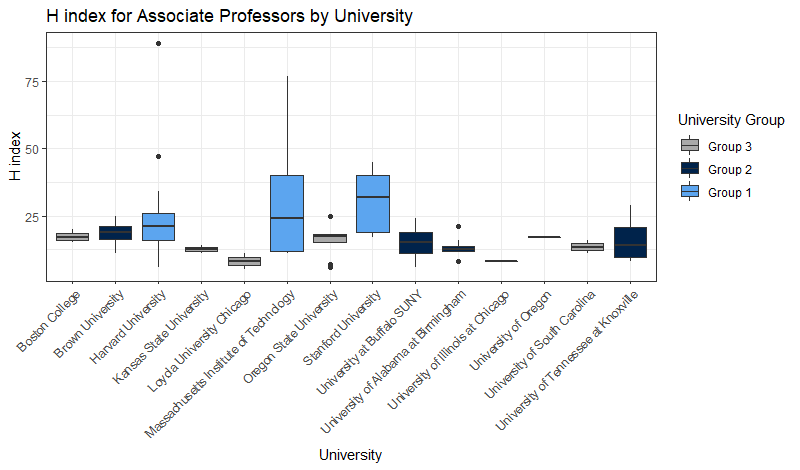
We compared the h-index of biologists hired/promoted to different academic levels across 3 groups of universities. Unsurprisingly, as a group those promoted to each successive academic rank had a significantly higher h-index than those hired or promoted to the previous rank. There were no significant differences between professors at group 2 and 3 universities, but there were differences between these and professors at group 1 universities.
![]()
Mean h-index for professors hired/promoted to…
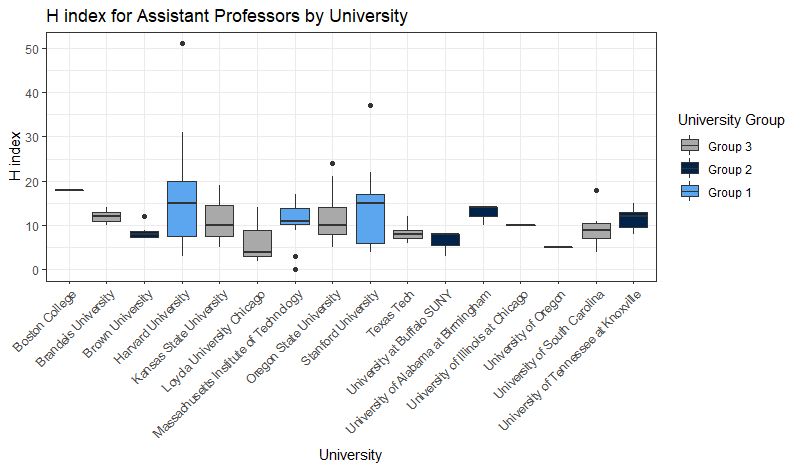
- assistant – 12
- associate – 20
- full – 42
The faculty in group 1 tended to have higher h-indices than those in groups 2 and 3, but there were also more outliers and a greater variance in group 1. These differences can be seen even at assistant professor and become exaggerated with increased rank.
Universities in group 1 had an increased number of faculty who used computational biology in their lab. To ensure that we had a similar number of faculty in each group, we sampled more universities for groups 2 and 3.
H-index to Percentile Calculator
In the boxes, you can compare your h-index to that of faculty who were hired/promoted to a given academic level.
If your percentile is 85, this means 15% of faculty hired to the selected position had an h-index that is greater than the input.
A special thanks to Niya Patel, Kyle Knuth, and Grace Ratley for their help in building the database and conducting the analyses.