Why do COVID Deaths Vary by State?
Cumulative COVID deaths are an endpoint to compare the effectiveness of states’ pandemic-related health policies. As the major risk factor for death from COVID is age, and some states have younger populations than others, it’s important to adjust for age when trying to understand factors that contribute to variable outcomes among states. Here we examine the relationships among age-adjusted COVID deaths and several variables of interest. Note that such comparisons cannot, on their own, be used to identify causal contributors to cumulative age-adjusted COVID deaths. Many features are highly co-linear and may serve as an imperfect proxy for underlying causes. However, these plots can be useful for hypothesis generation, and can support (but not prove) the lack of a strong causal relationship when there appears to be no association at all. We recommend bearing in mind the ecological fallacy.
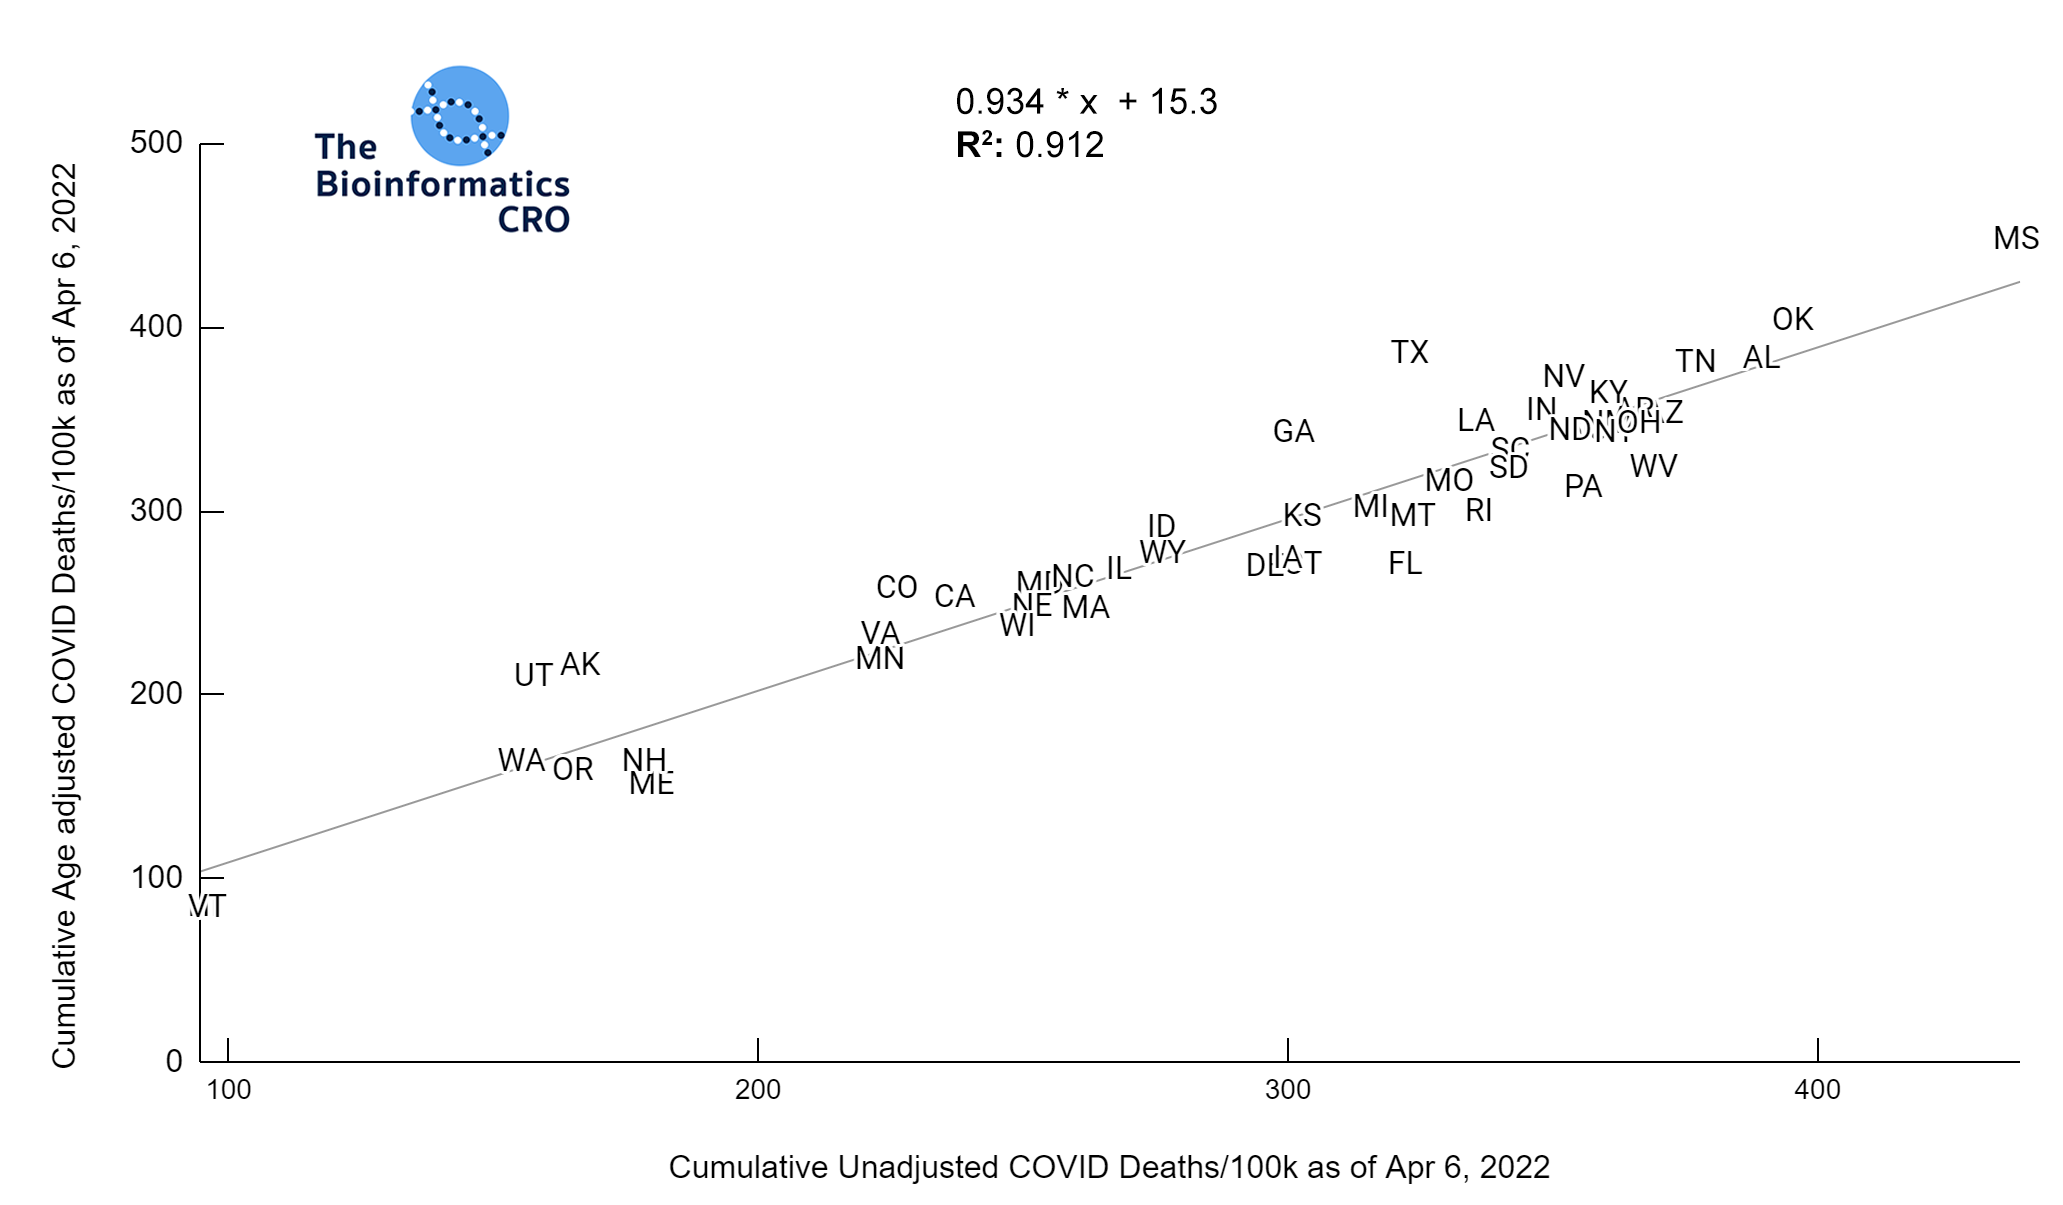
The chart above shows the relationship between age-adjusted COVID deaths and unadjusted deaths. States with younger populations such as Texas perform worse after age adjustment, while states with older populations such as Florida perform better.
Summary
- Vaccination rate is the single biggest predictor of age-adjusted deaths by state.
- COVID deaths do not correlate with state stringency after adjusting for age and obesity rate.
- State stringency correlates with unemployment rate but not with non-COVID excess deaths, depression or suicide vs baseline.
- Partisanship is a strong predictor of vaccination rate, but not of deaths after accounting for age, vaccination rate and obesity.
This is incomplete and there are many factors as yet unexamined. We will add more visualizations over time.
Vaccination
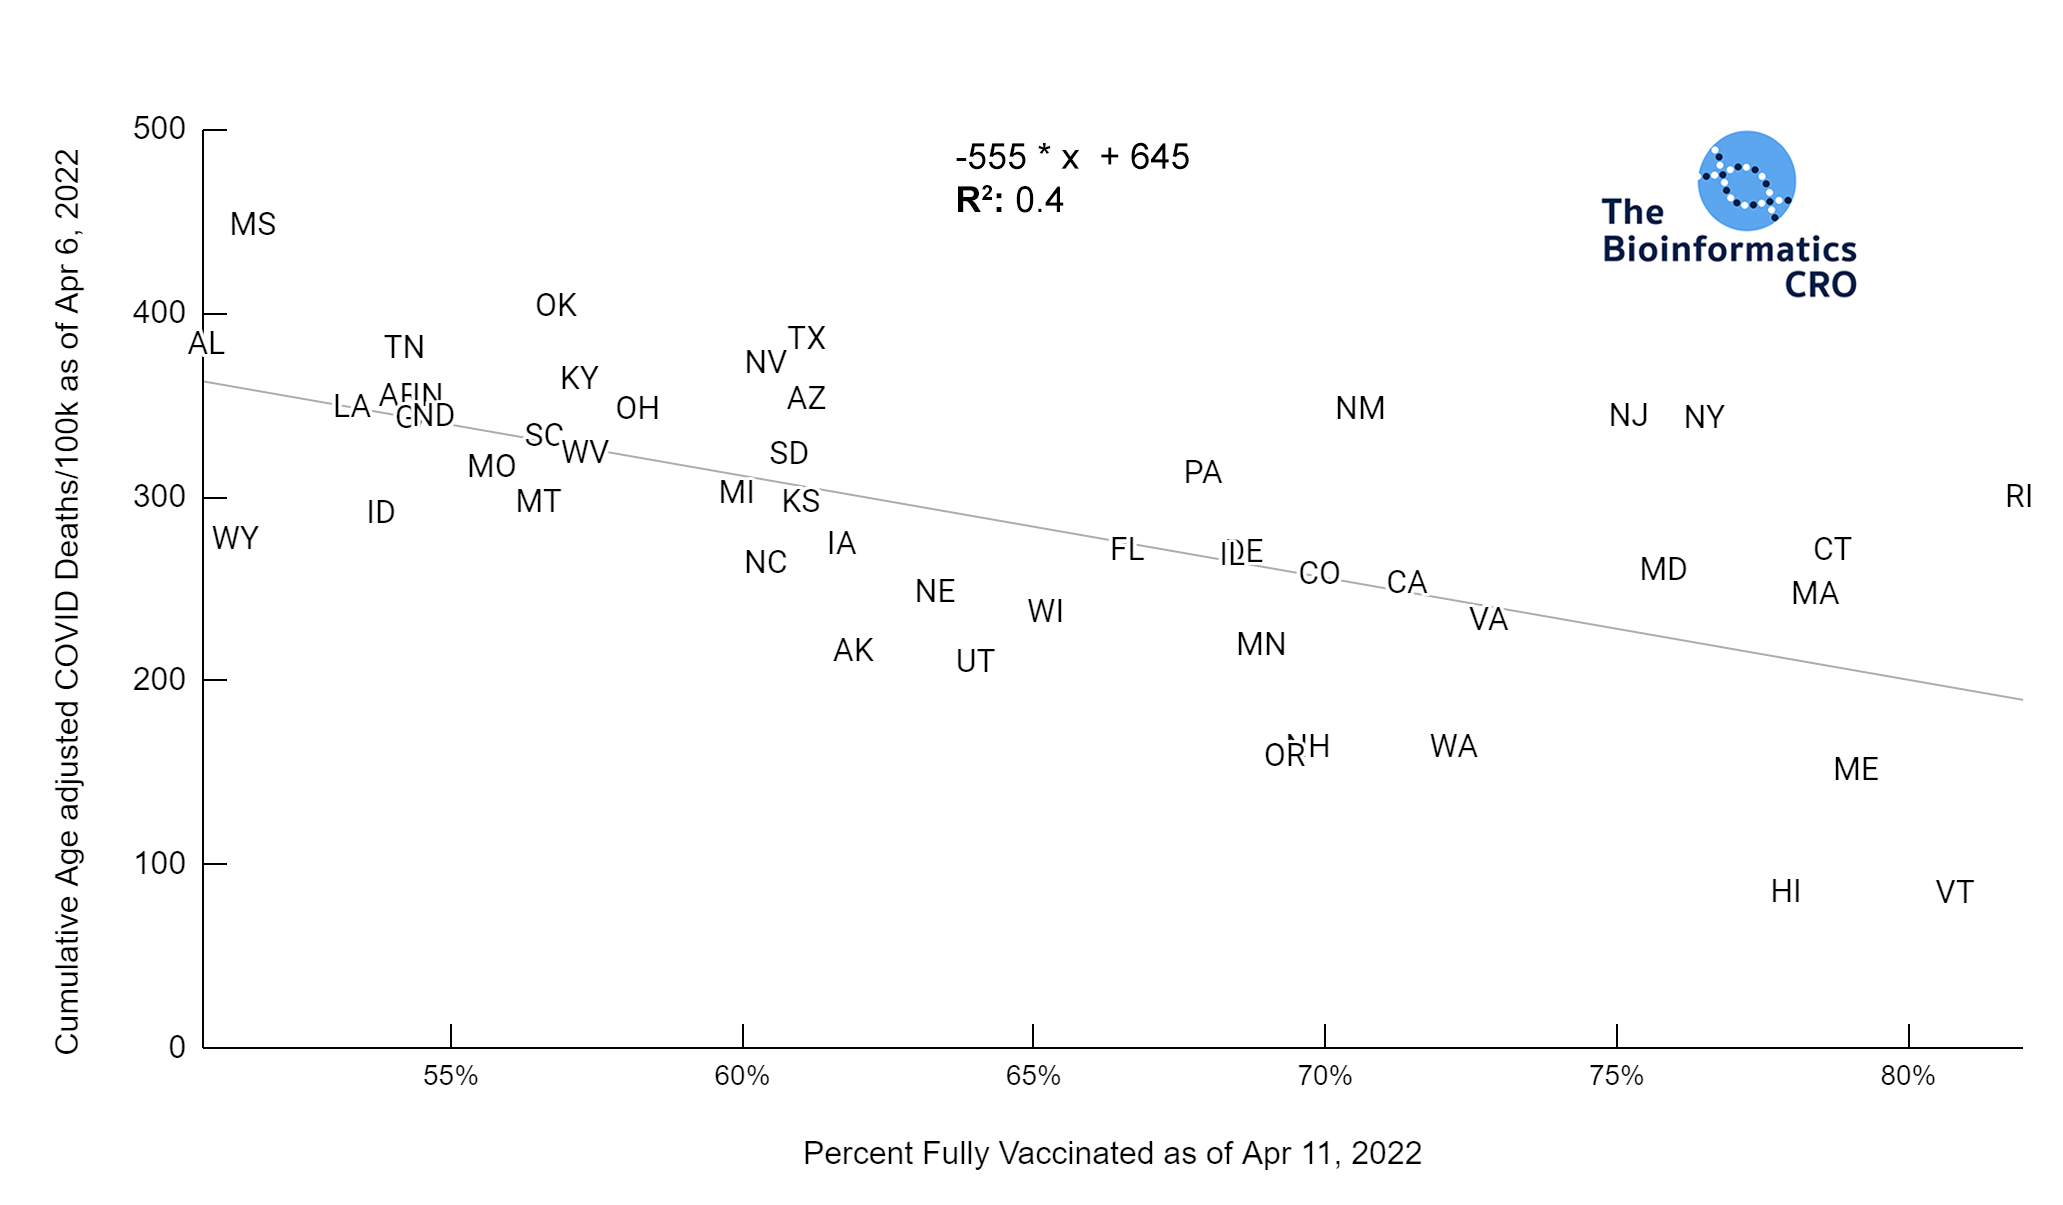
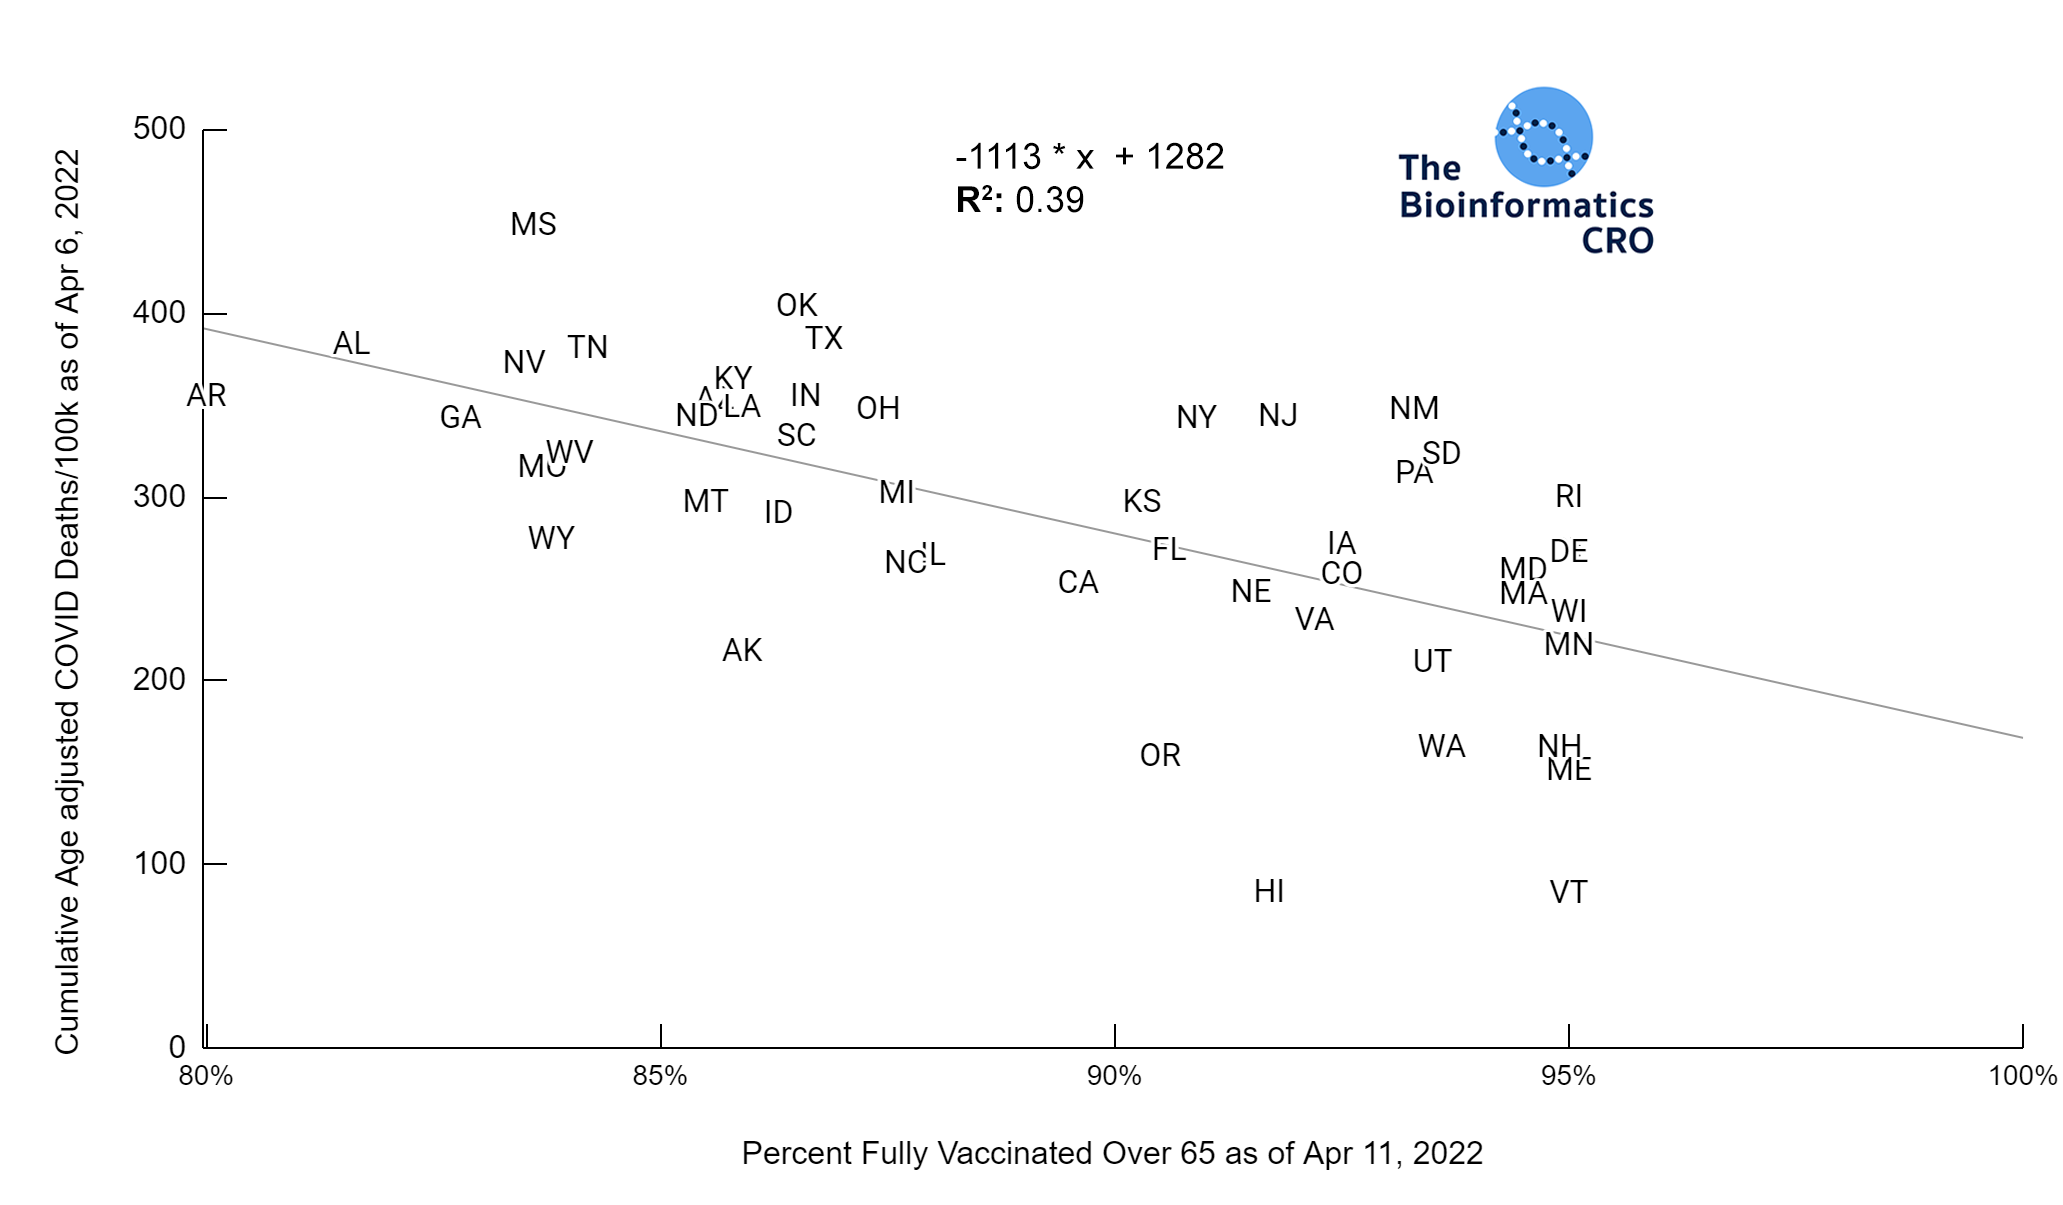
Vaccination is highly effective in preventing severe outcomes and death from COVID infection. Indeed state vaccination rate has a strong negative correlation with age-adjusted COVID deaths (P<0.01). In the 65+ age group, there is a similarly high correlation (P<0.01) with age adjusted COVID deaths. Note that the CDC caps vaccination coverage metrics at 95%, due to issues tracking first and second doses. Because vaccination over 65 is the strongest single predictor of age-adjusted deaths, we also present cumulative COVID deaths adjusting for both age and vaccination rate over 65.
Vaccination Rate and Age Adjusted COVID Deaths
Vaccination Rate Over 65 Years of Age
Vaccination Rate 65+ and Age & Obesity Adjusted COVID Deaths
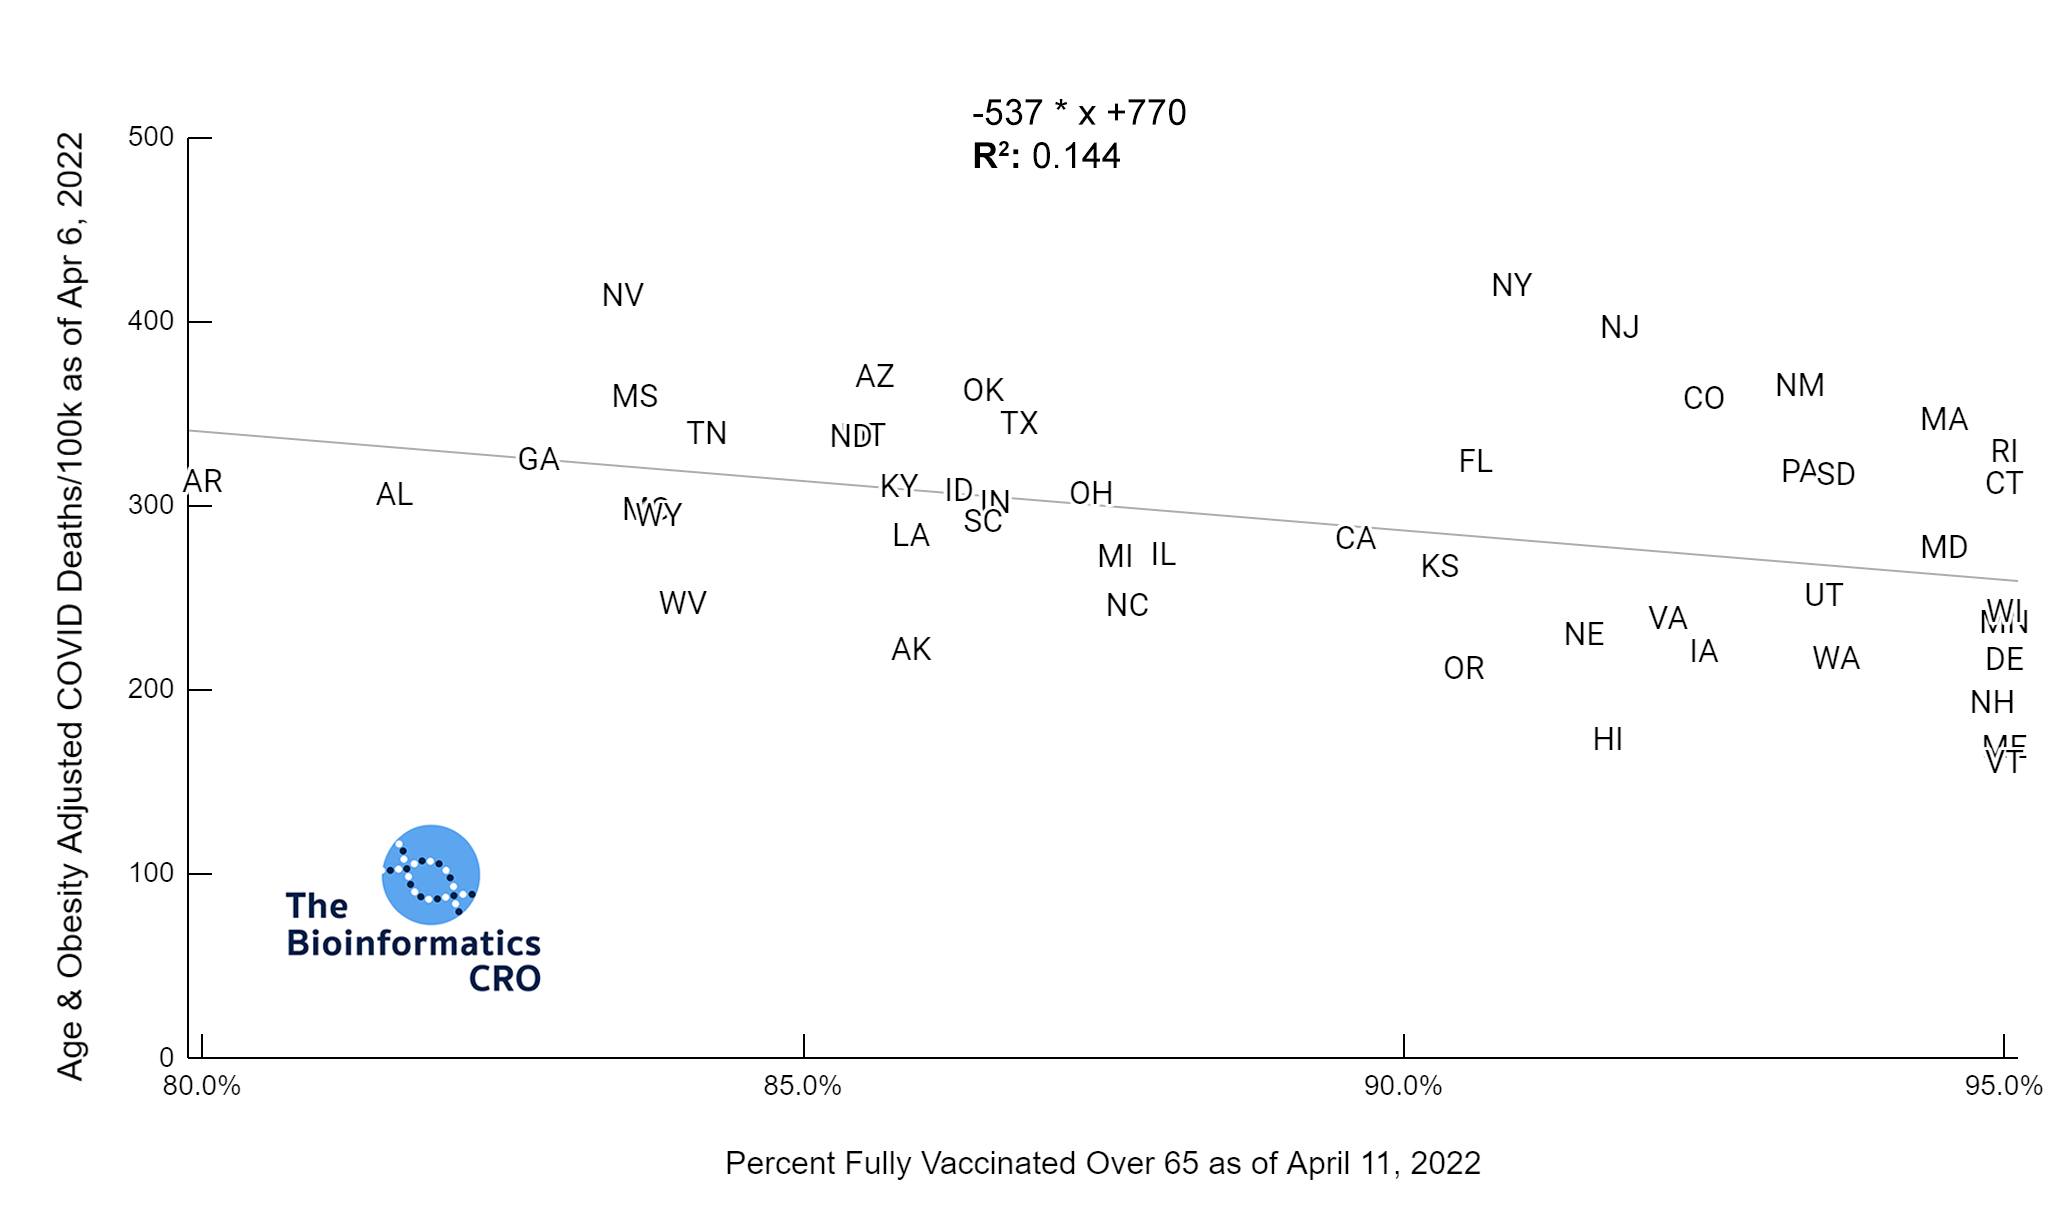
There is a moderate negative correlation (P<0.01) between vaccination and COVID deaths when adjusting for age and obesity. The reduction in correlation is due to collinearity between state obesity rates and vaccination rates. That is, states with higher adult obesity rates tend to have lower vaccination rates (P<0.01). In a multivariate linear model of age-adjusted deaths, vaccination over 65, and obesity, both showed significant correlation with deaths and had a multiple R² of 0.48.
Stringency Index
Stringency Index is a useful tool for comparing government response to the pandemic. It is the average of nine policy metrics, including:
- School closures
- Workplace closures
- Cancellation of public events
- Restrictions on public gatherings
- Closures of public transport
- Stay-at-home requirements
- Public information campaigns
- Restrictions on internal movements
- International travel controls
The higher the stringency index, which has a maximum value of 100, the stricter a government’s response to the pandemic. Stringency index does not factor in compliance with government policy. For more information on Stringency Index and its calculation visit ourworldindata.org/
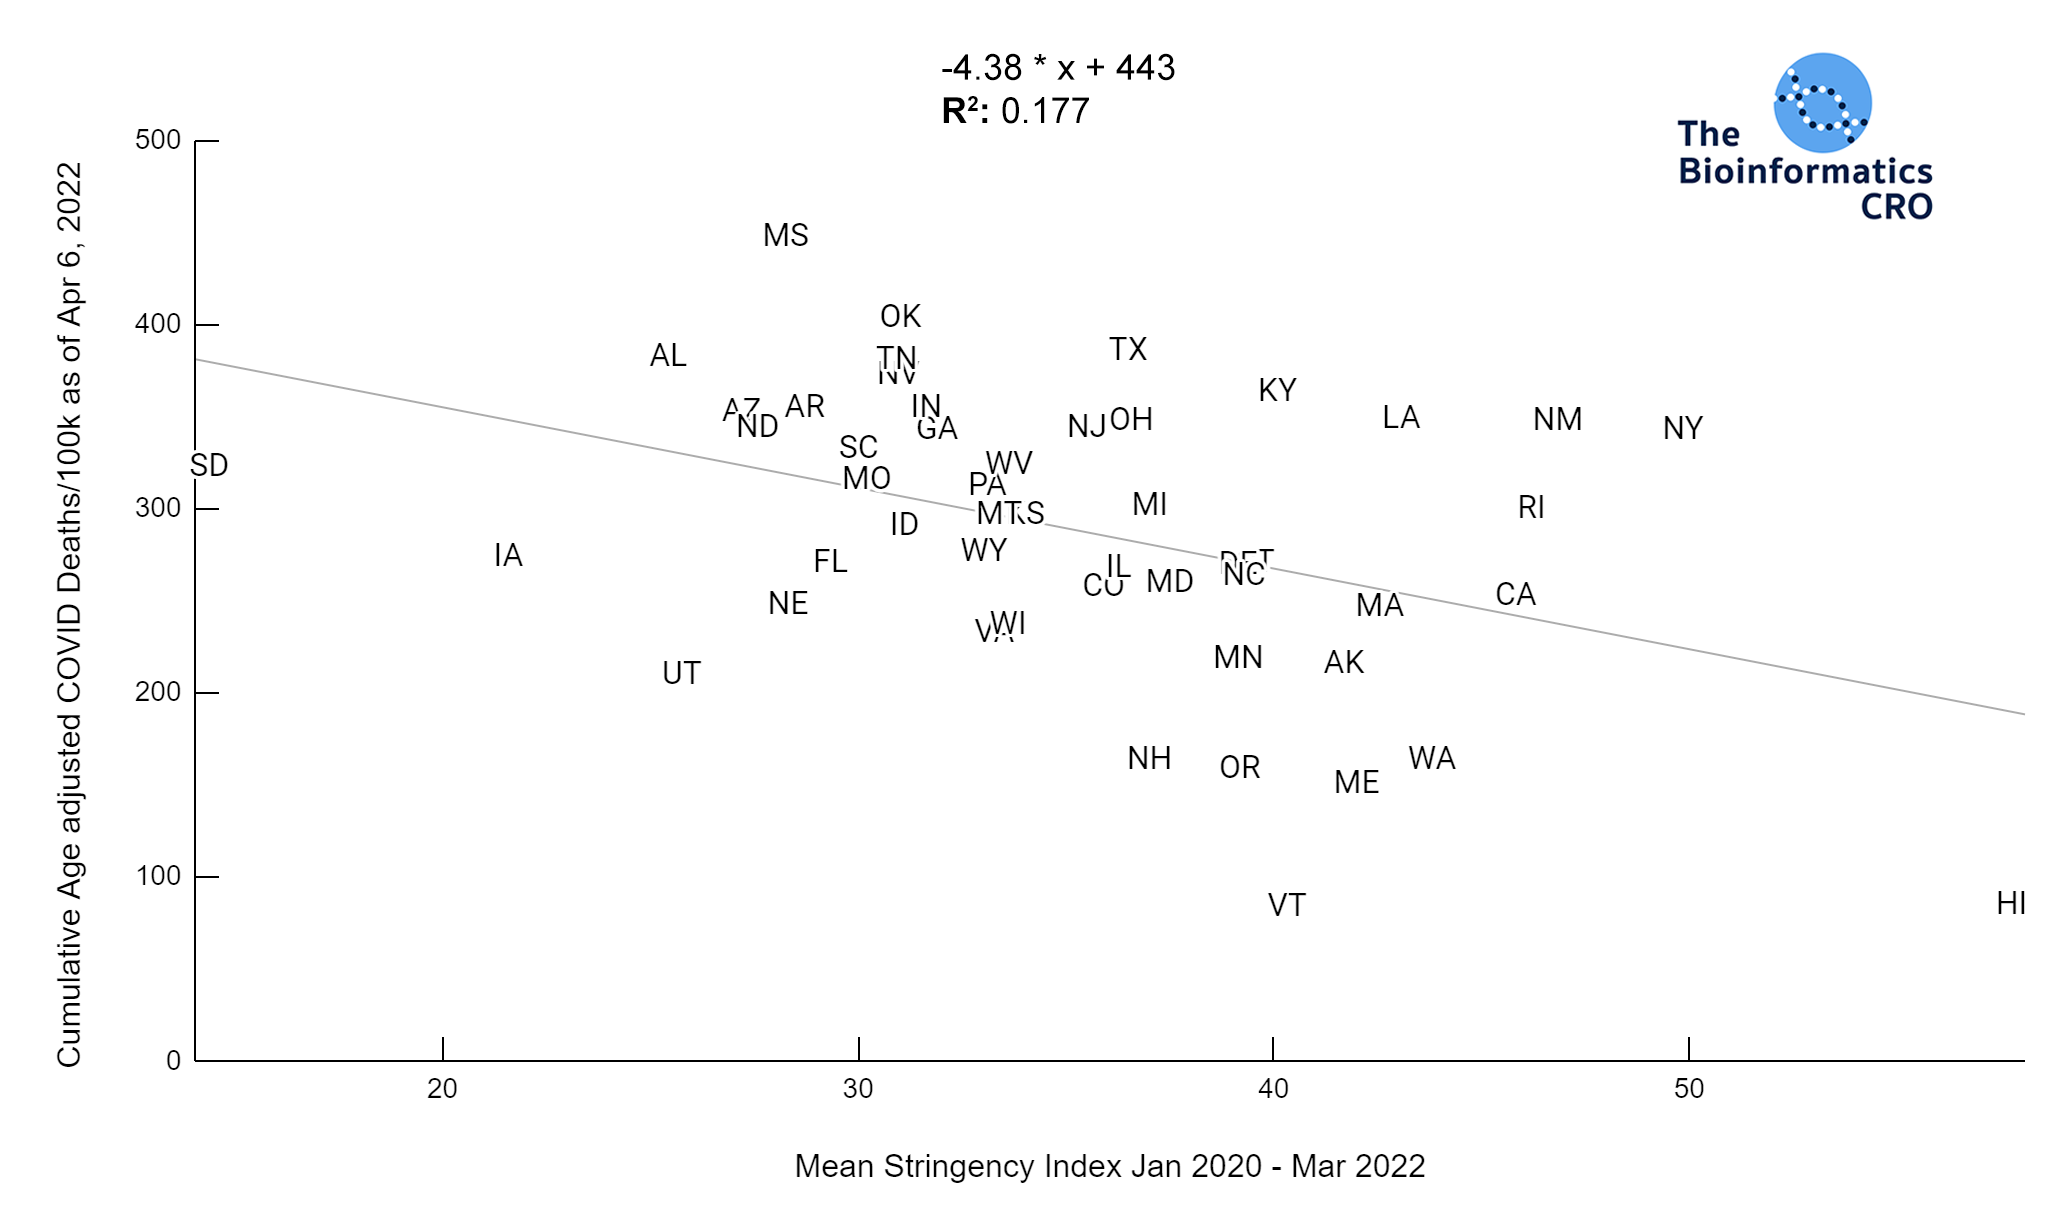
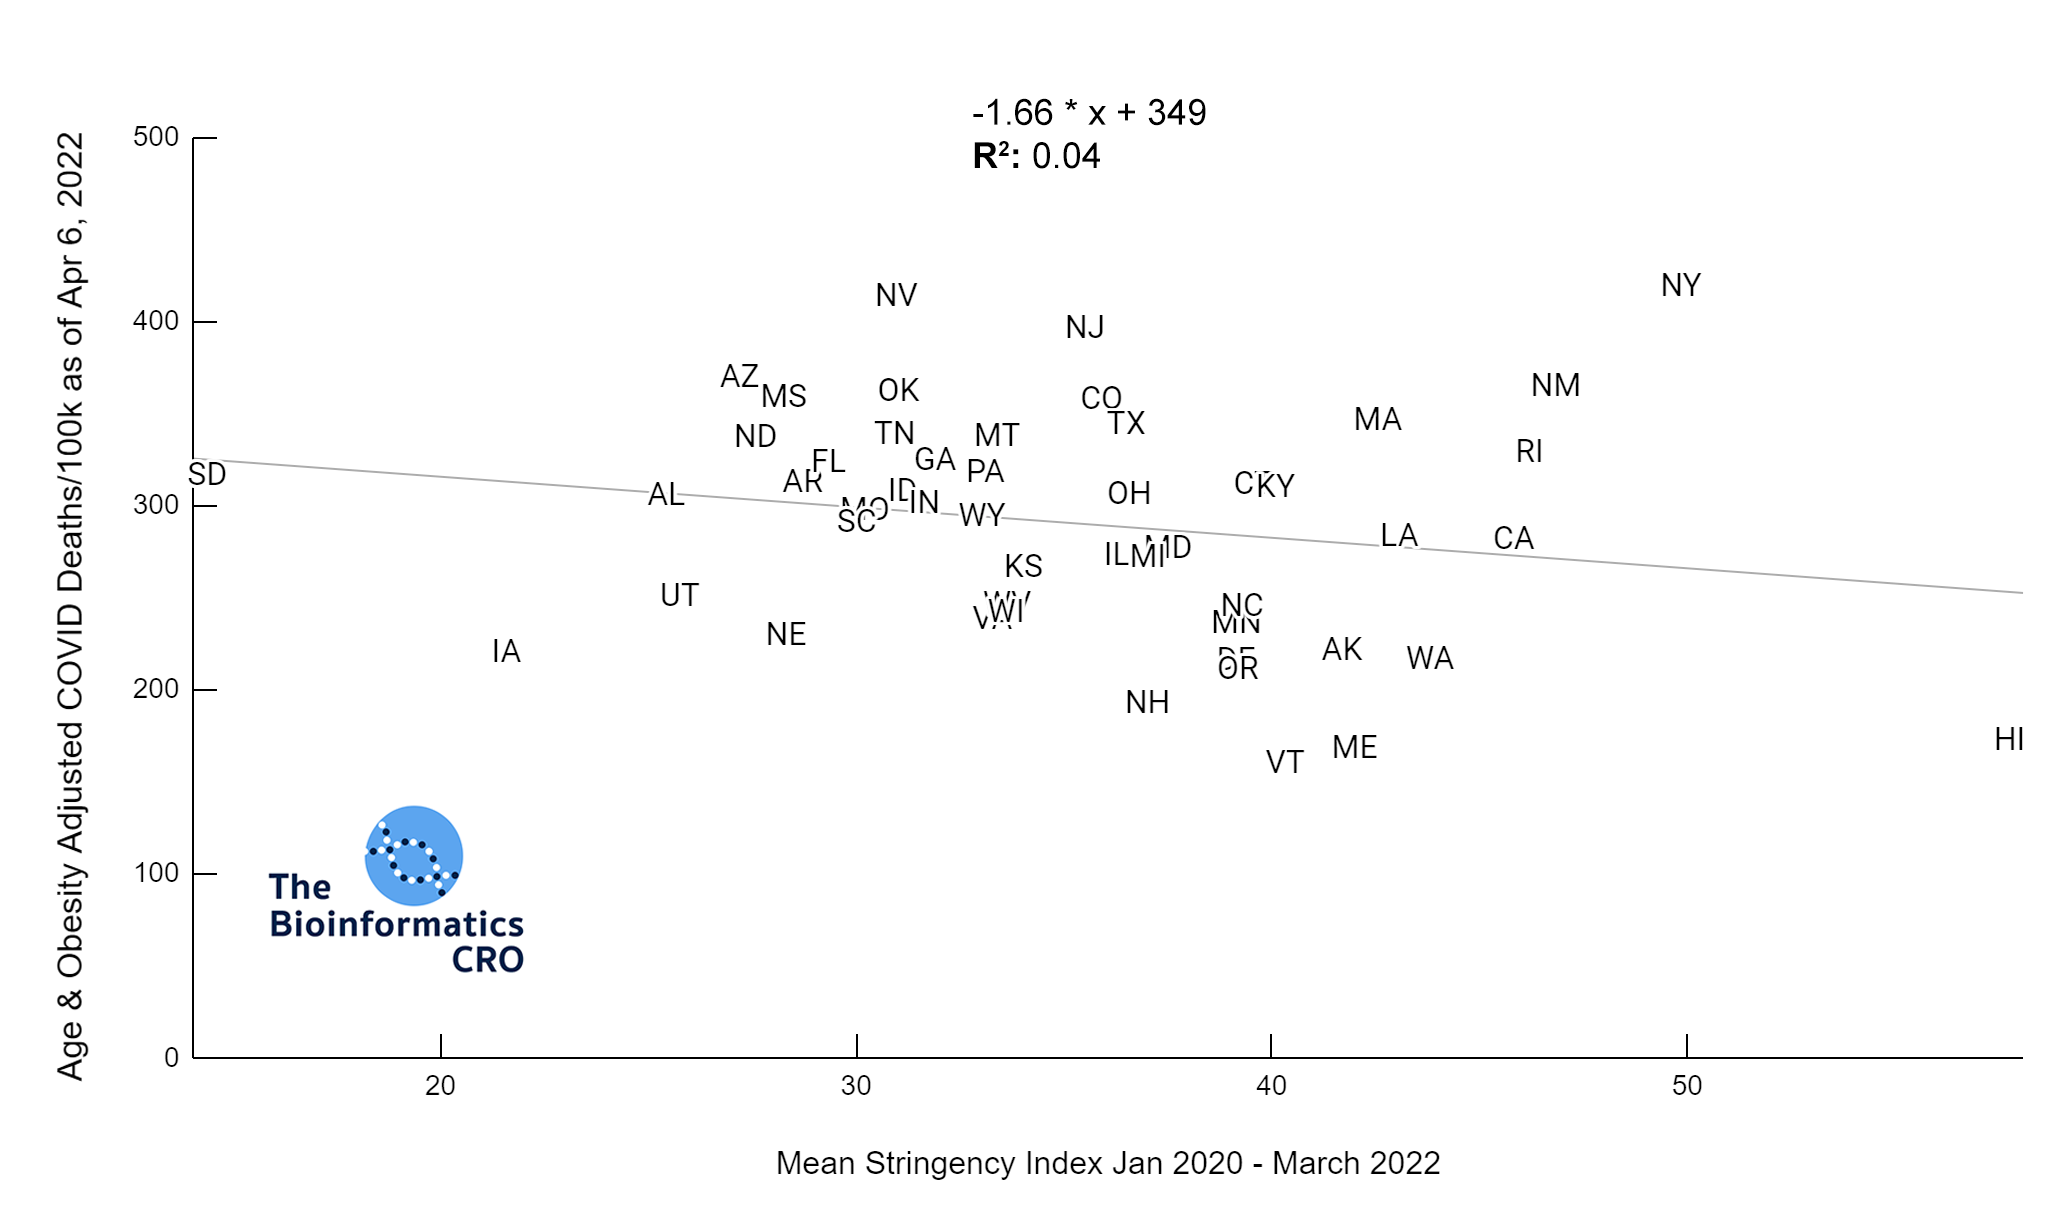
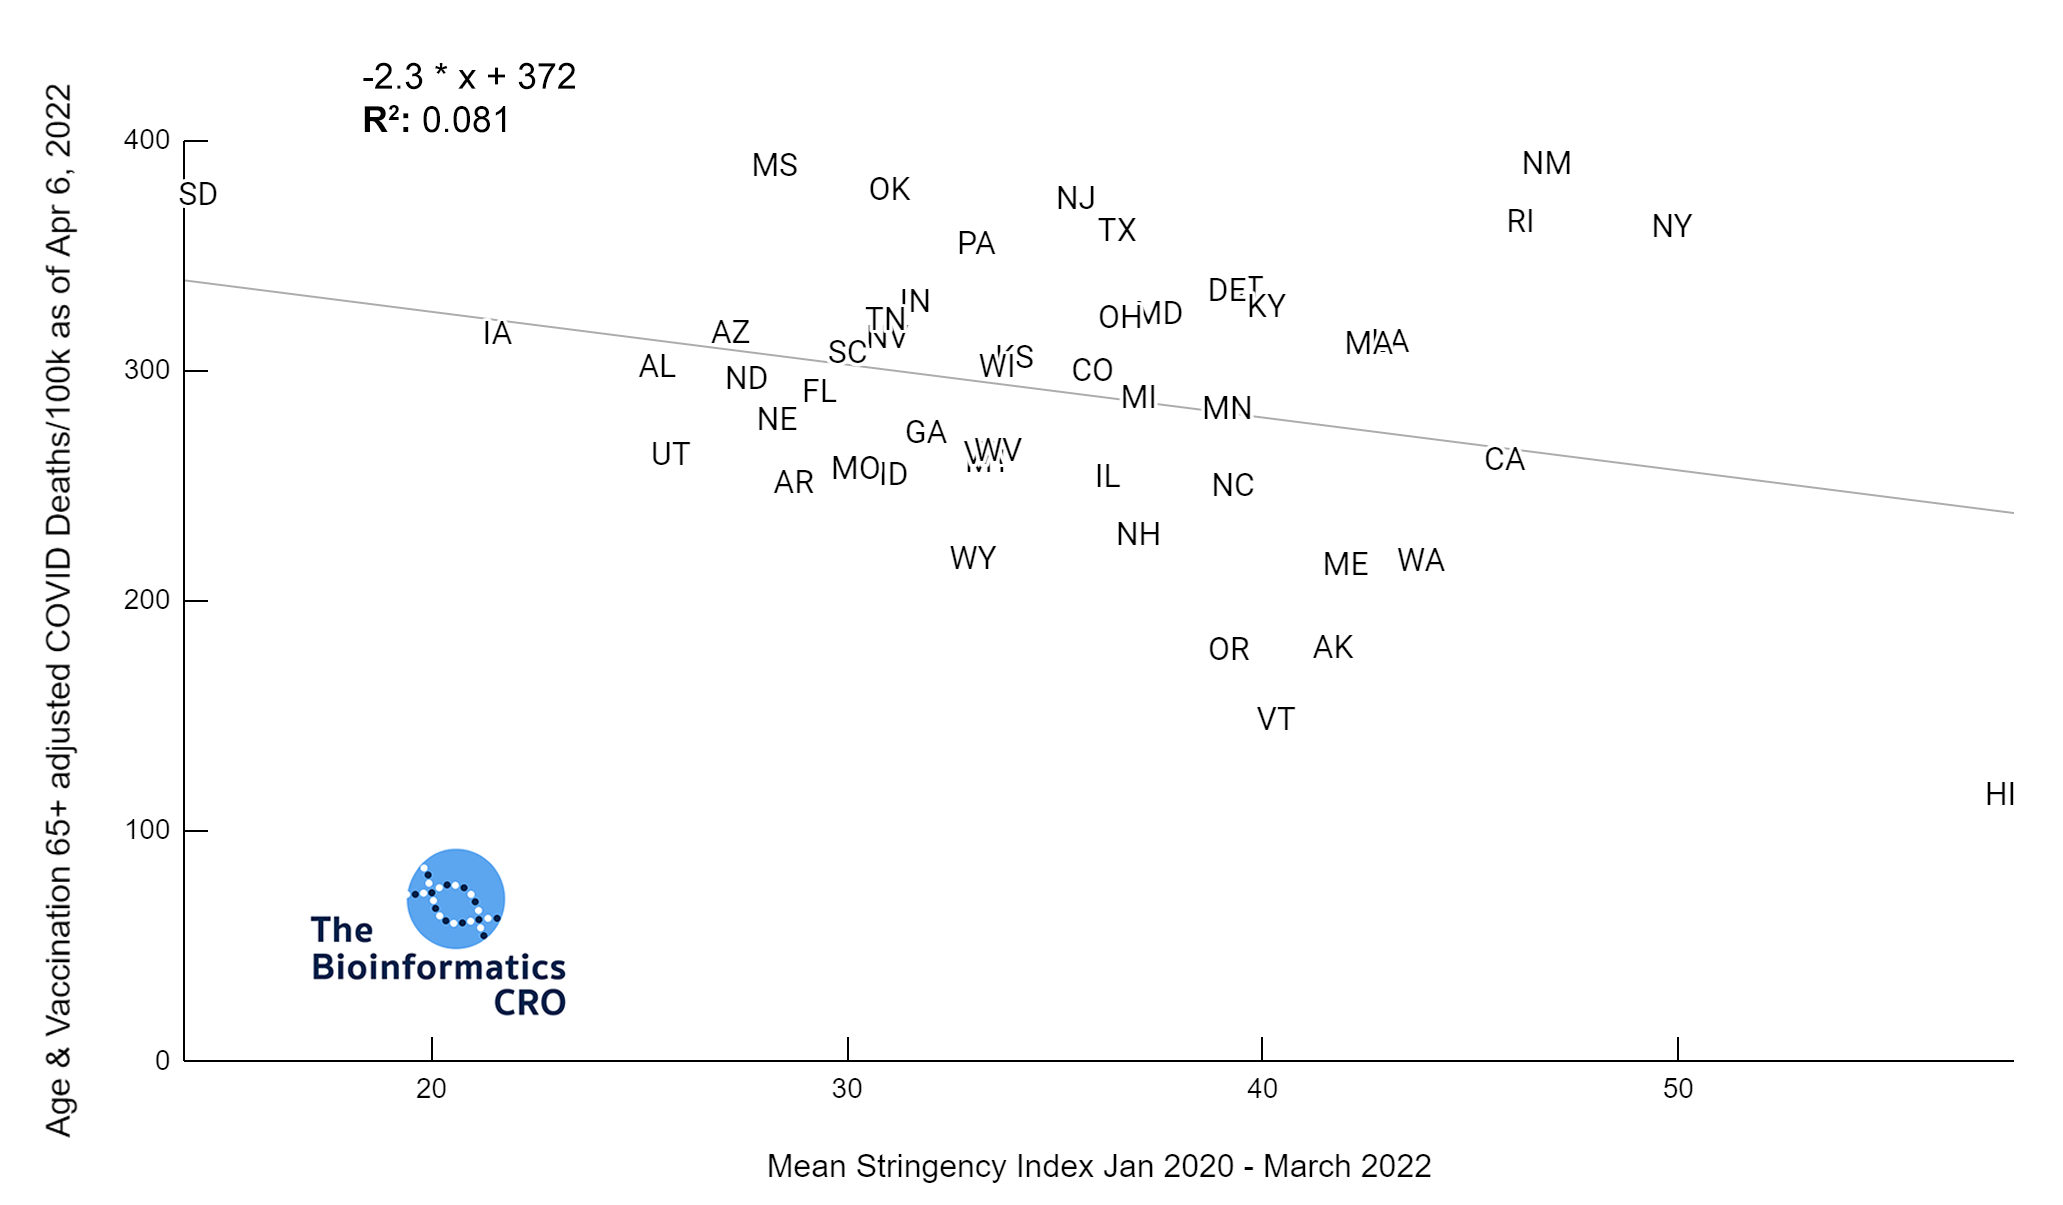
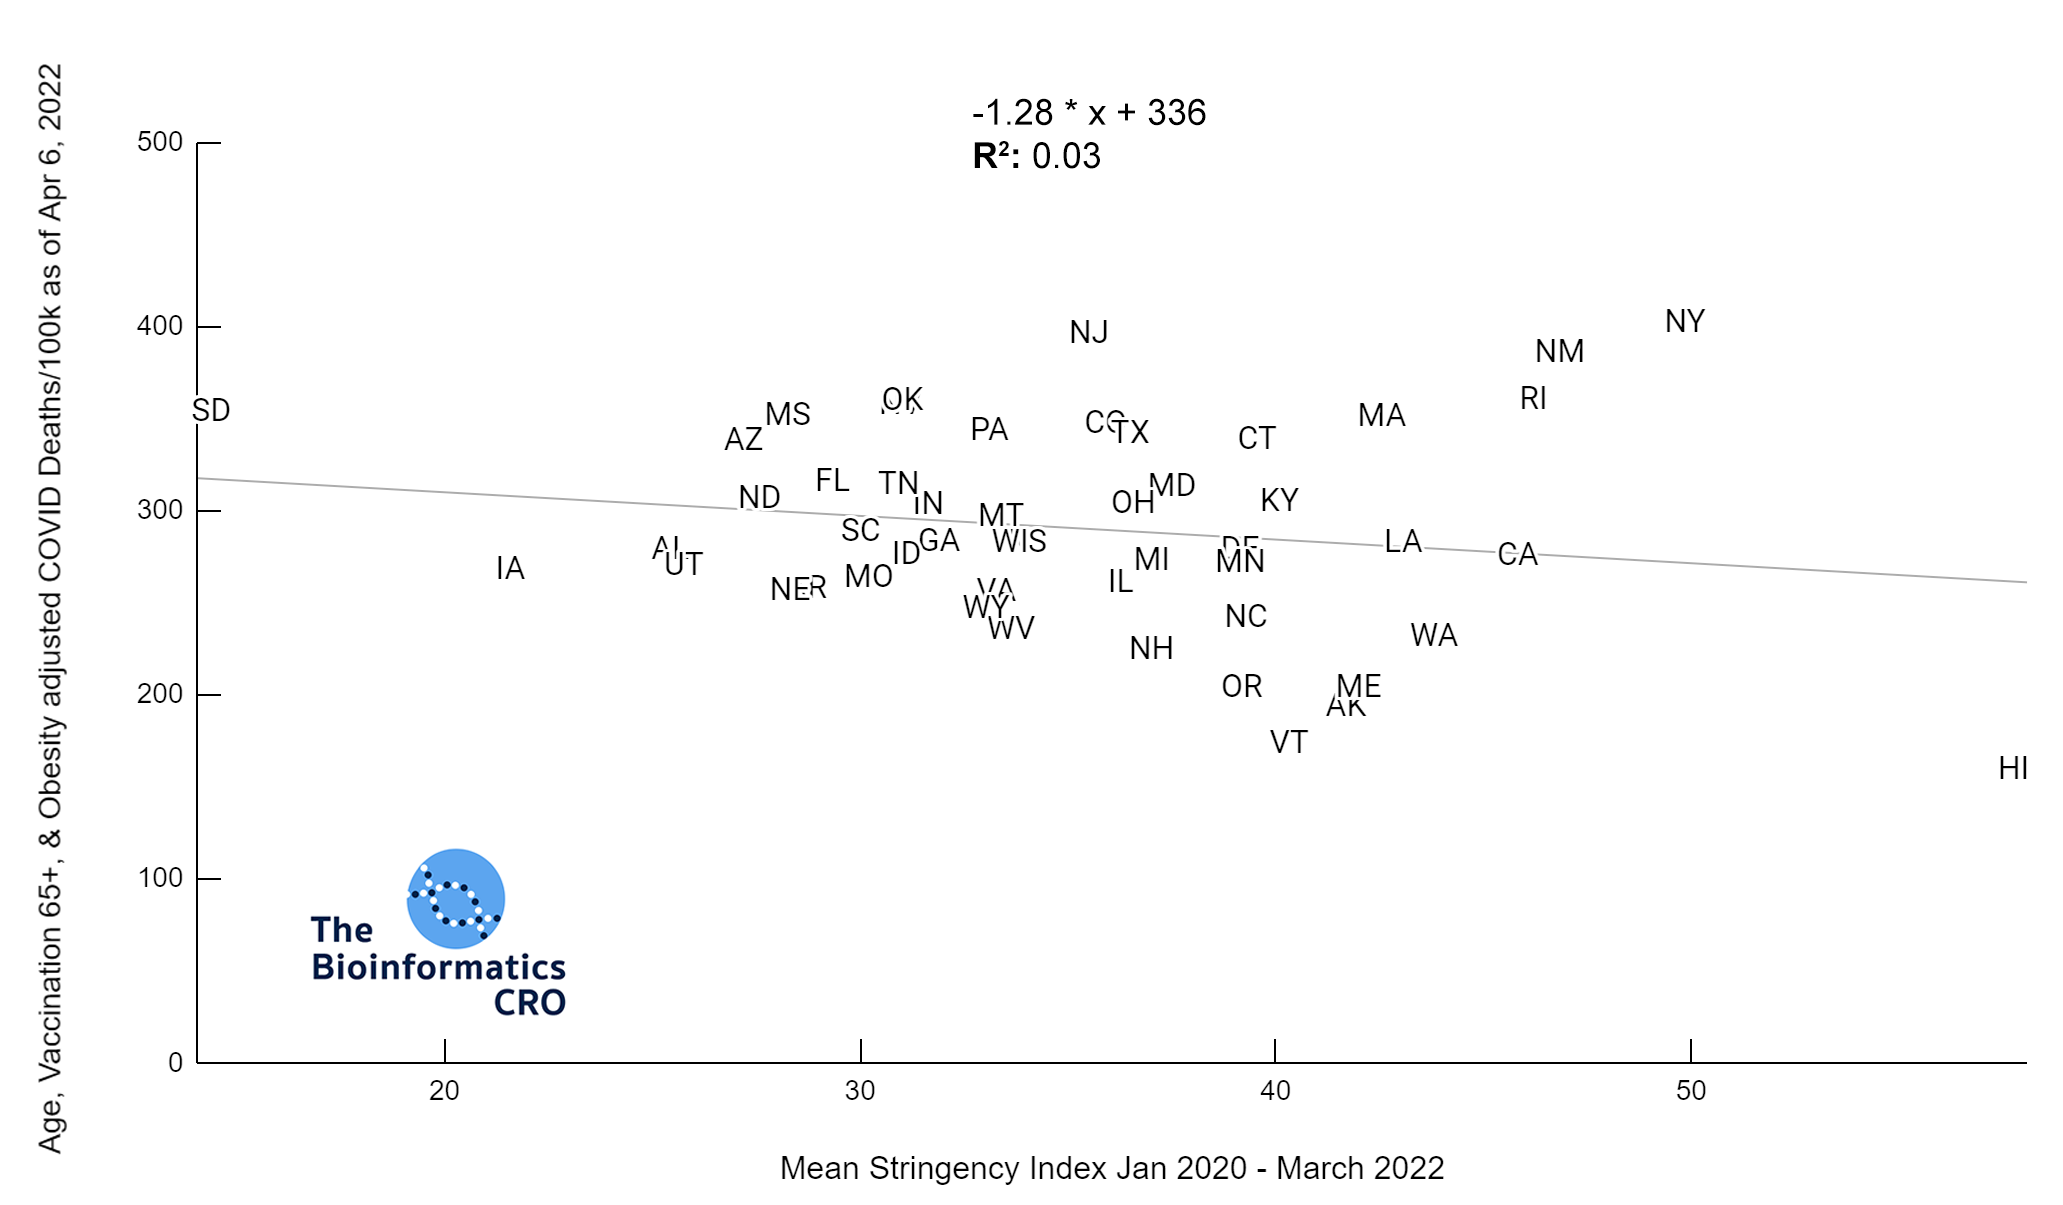
The charts above show a moderate negative correlation between the average strictness of pandemic-related policy and age adjusted COVID deaths (P<0.01) and a weak negative correlation between vaccination and age adjusted COVID deaths (Vaccination 65+ adjusted P=0.045). However, when deaths are additionally adjusted for obesity, there is no longer a significant correlation (Obesity adjusted P=0.16, Obesity and Vaccination 65+ adjusted P=0.22). Although some studies have suggested policies are effective in reducing COVID deaths and reducing strain on hospitals (1, 2, 3), effectiveness may decline over time with reduced compliance as more people are experiencing “lockdown fatigue“. Additionally, a recent meta-analysis found effectively no impact of lockdowns on mortality. As we are visualizing cumulative deaths across the pandemic, we will not see short-term impacts.
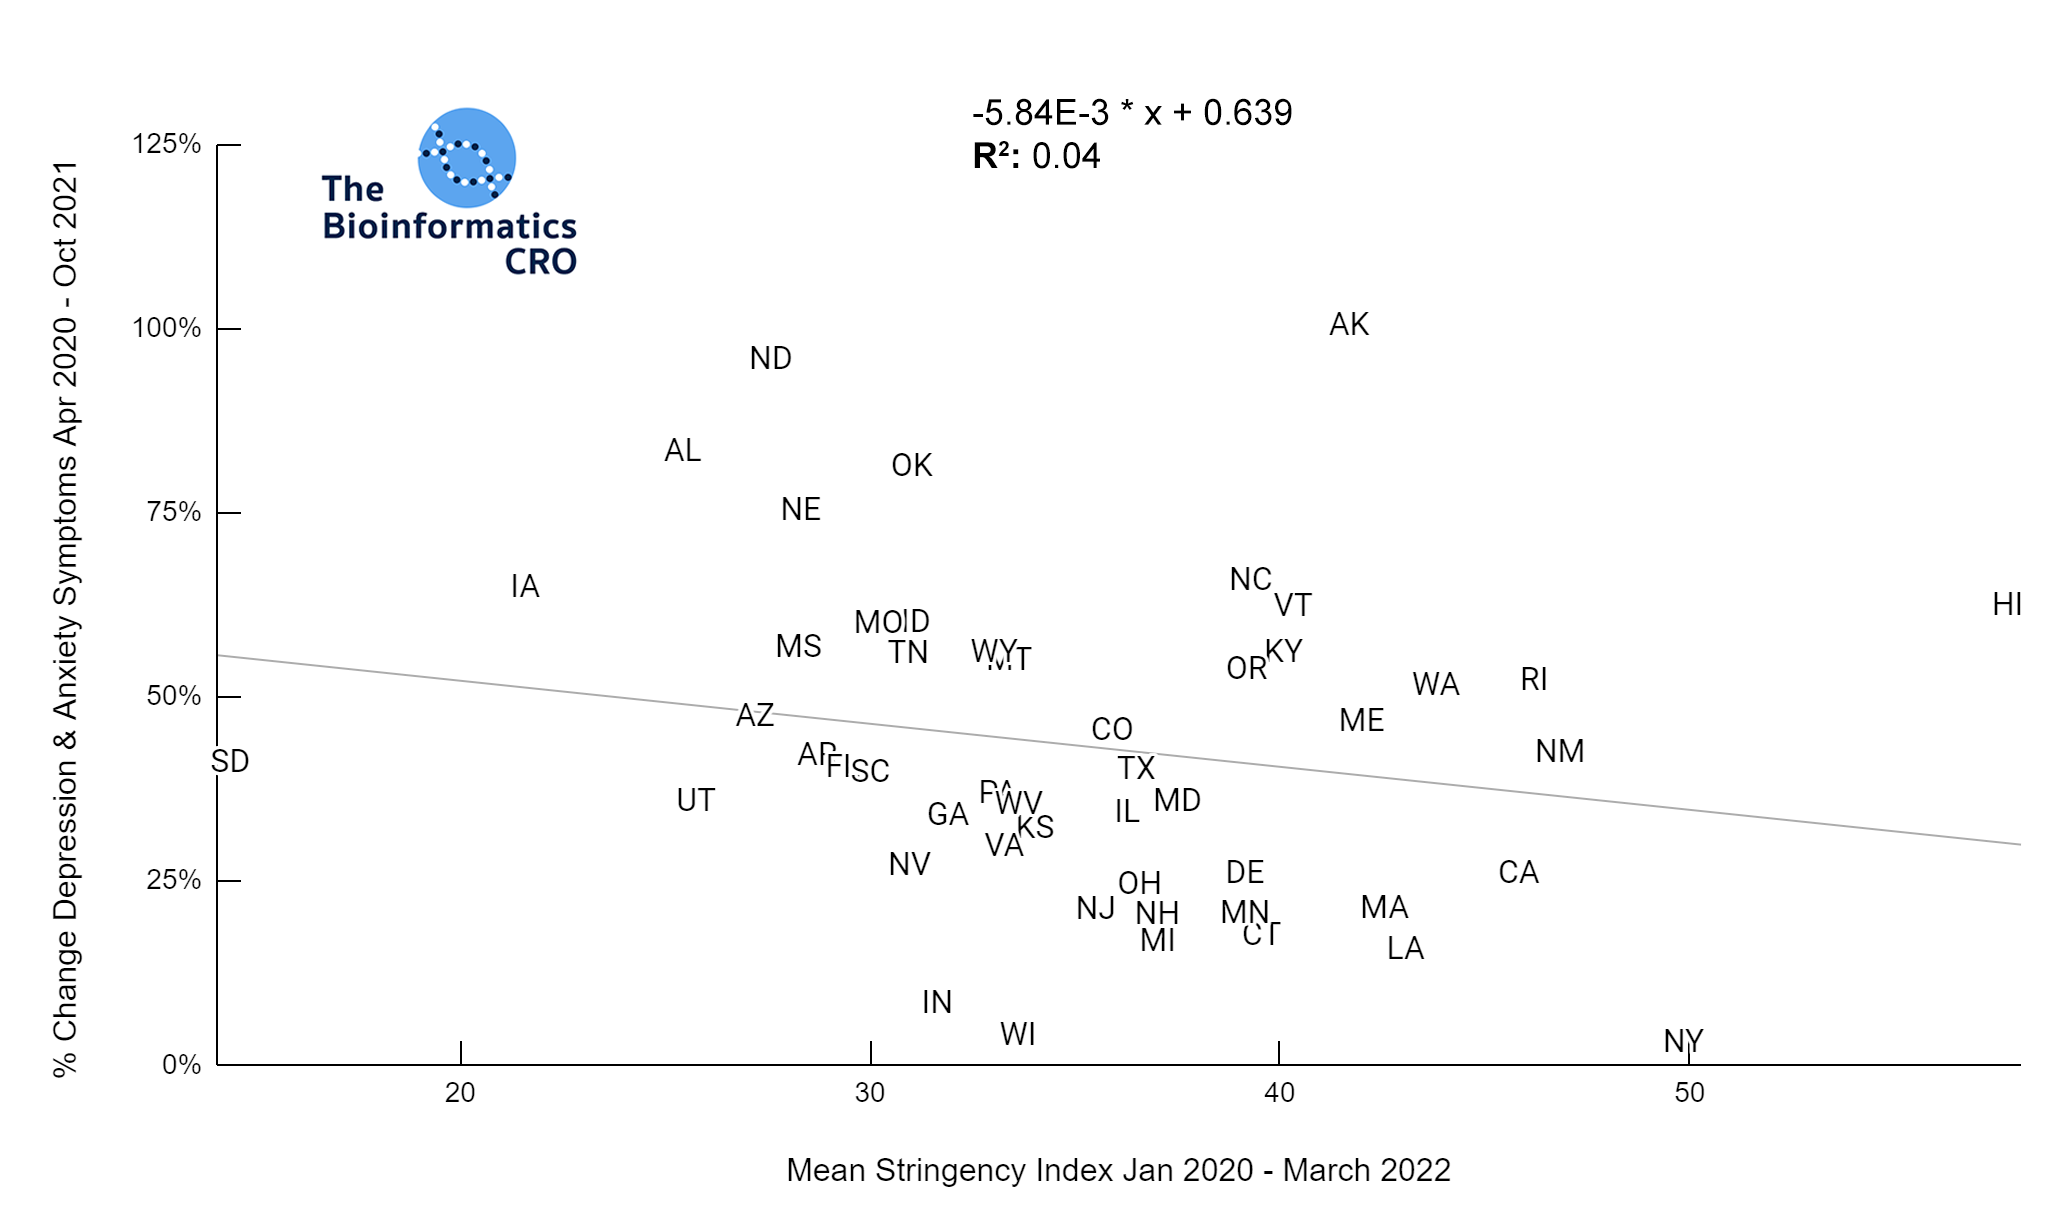
Mean Stringency Index and Adult Depression & Anxiety
Stringency Index and Suicide
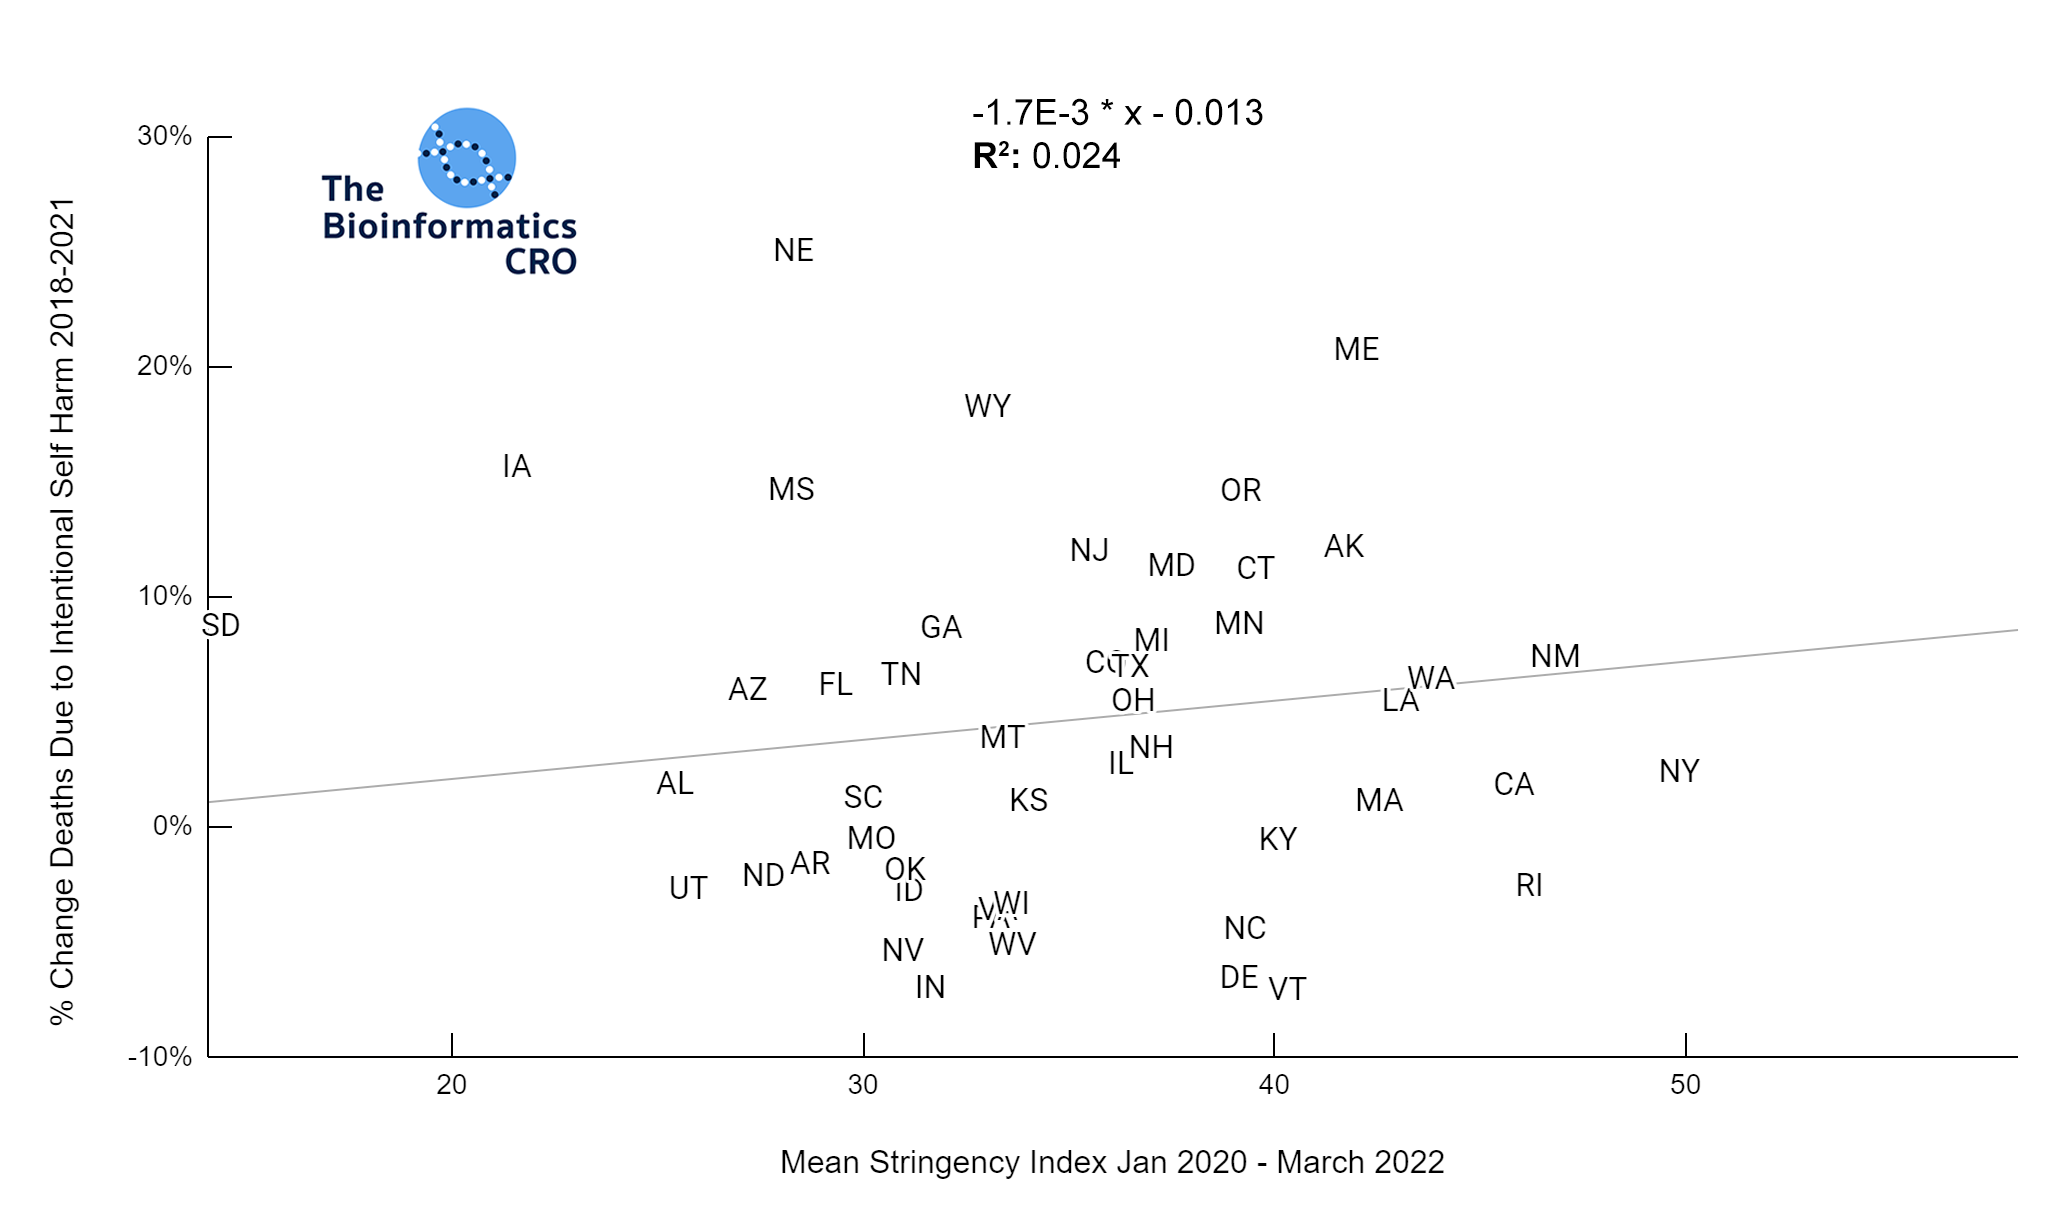
All states in the US observed an increase in depression and anxiety symptoms over the course of the pandemic. However, these increases were not significantly correlated with mean stringency index (P=0.16). Further, mean stringency index was not correlated with the % change in suicide mortality between 2018 and 2021 (P=0.28).
Stringency Index and Unemployment
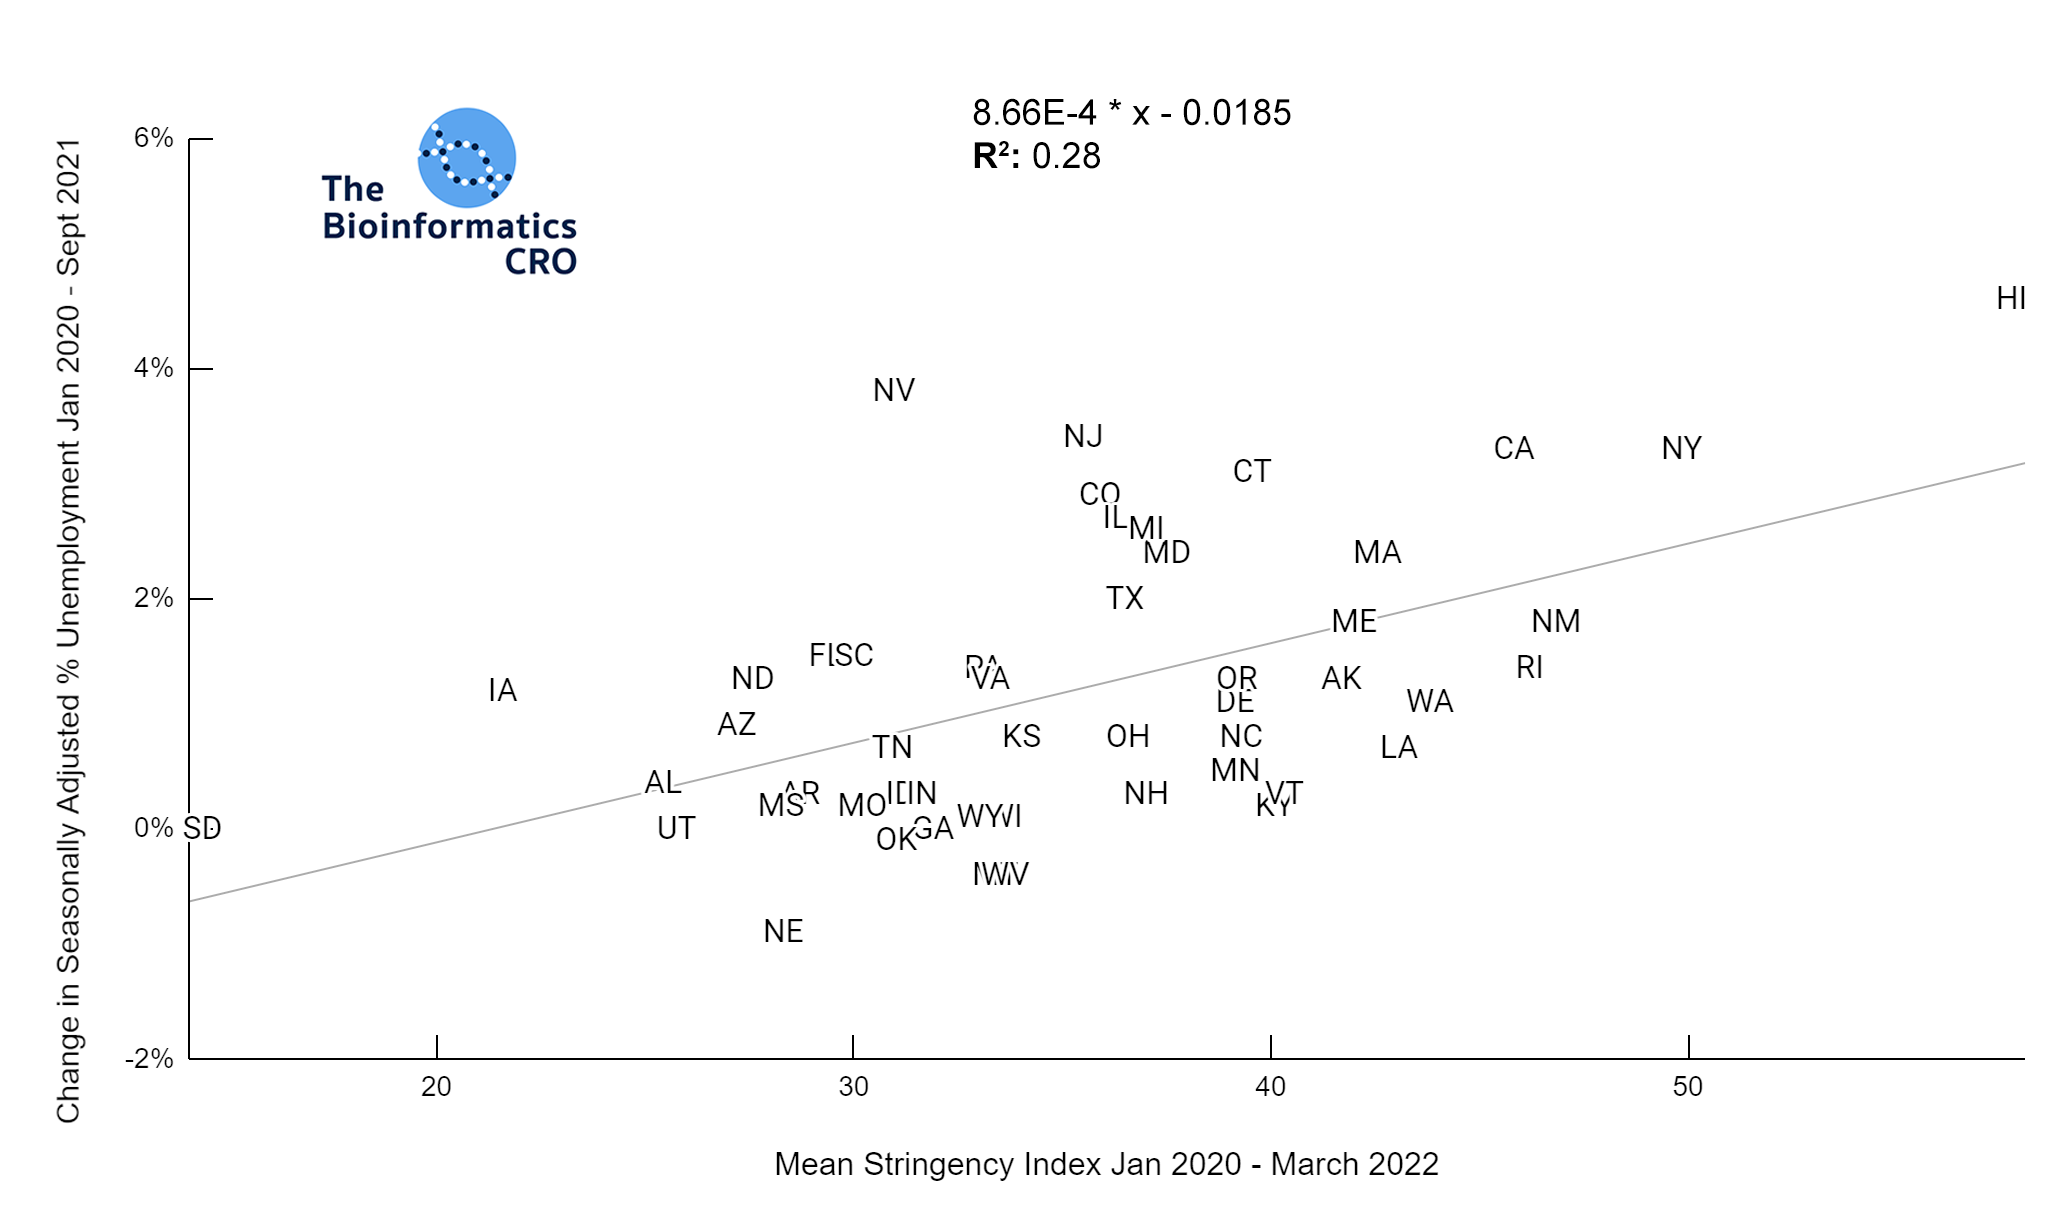
Stringency index was moderately correlated with the % change in unemployment from the start of the pandemic to Sept 2021 (P<0.01) For further reading about the economic impacts of the COVID pandemic and government interventions see the following articles: The COVID-19 crisis: what explains cross-country differences in the pandemic’s short-term economic impact?, Epidemiological and economic impact of COVID-19 in the US, and
Pandemic Impact on Mortality and Economy Varies Across Age Groups and Geographies.
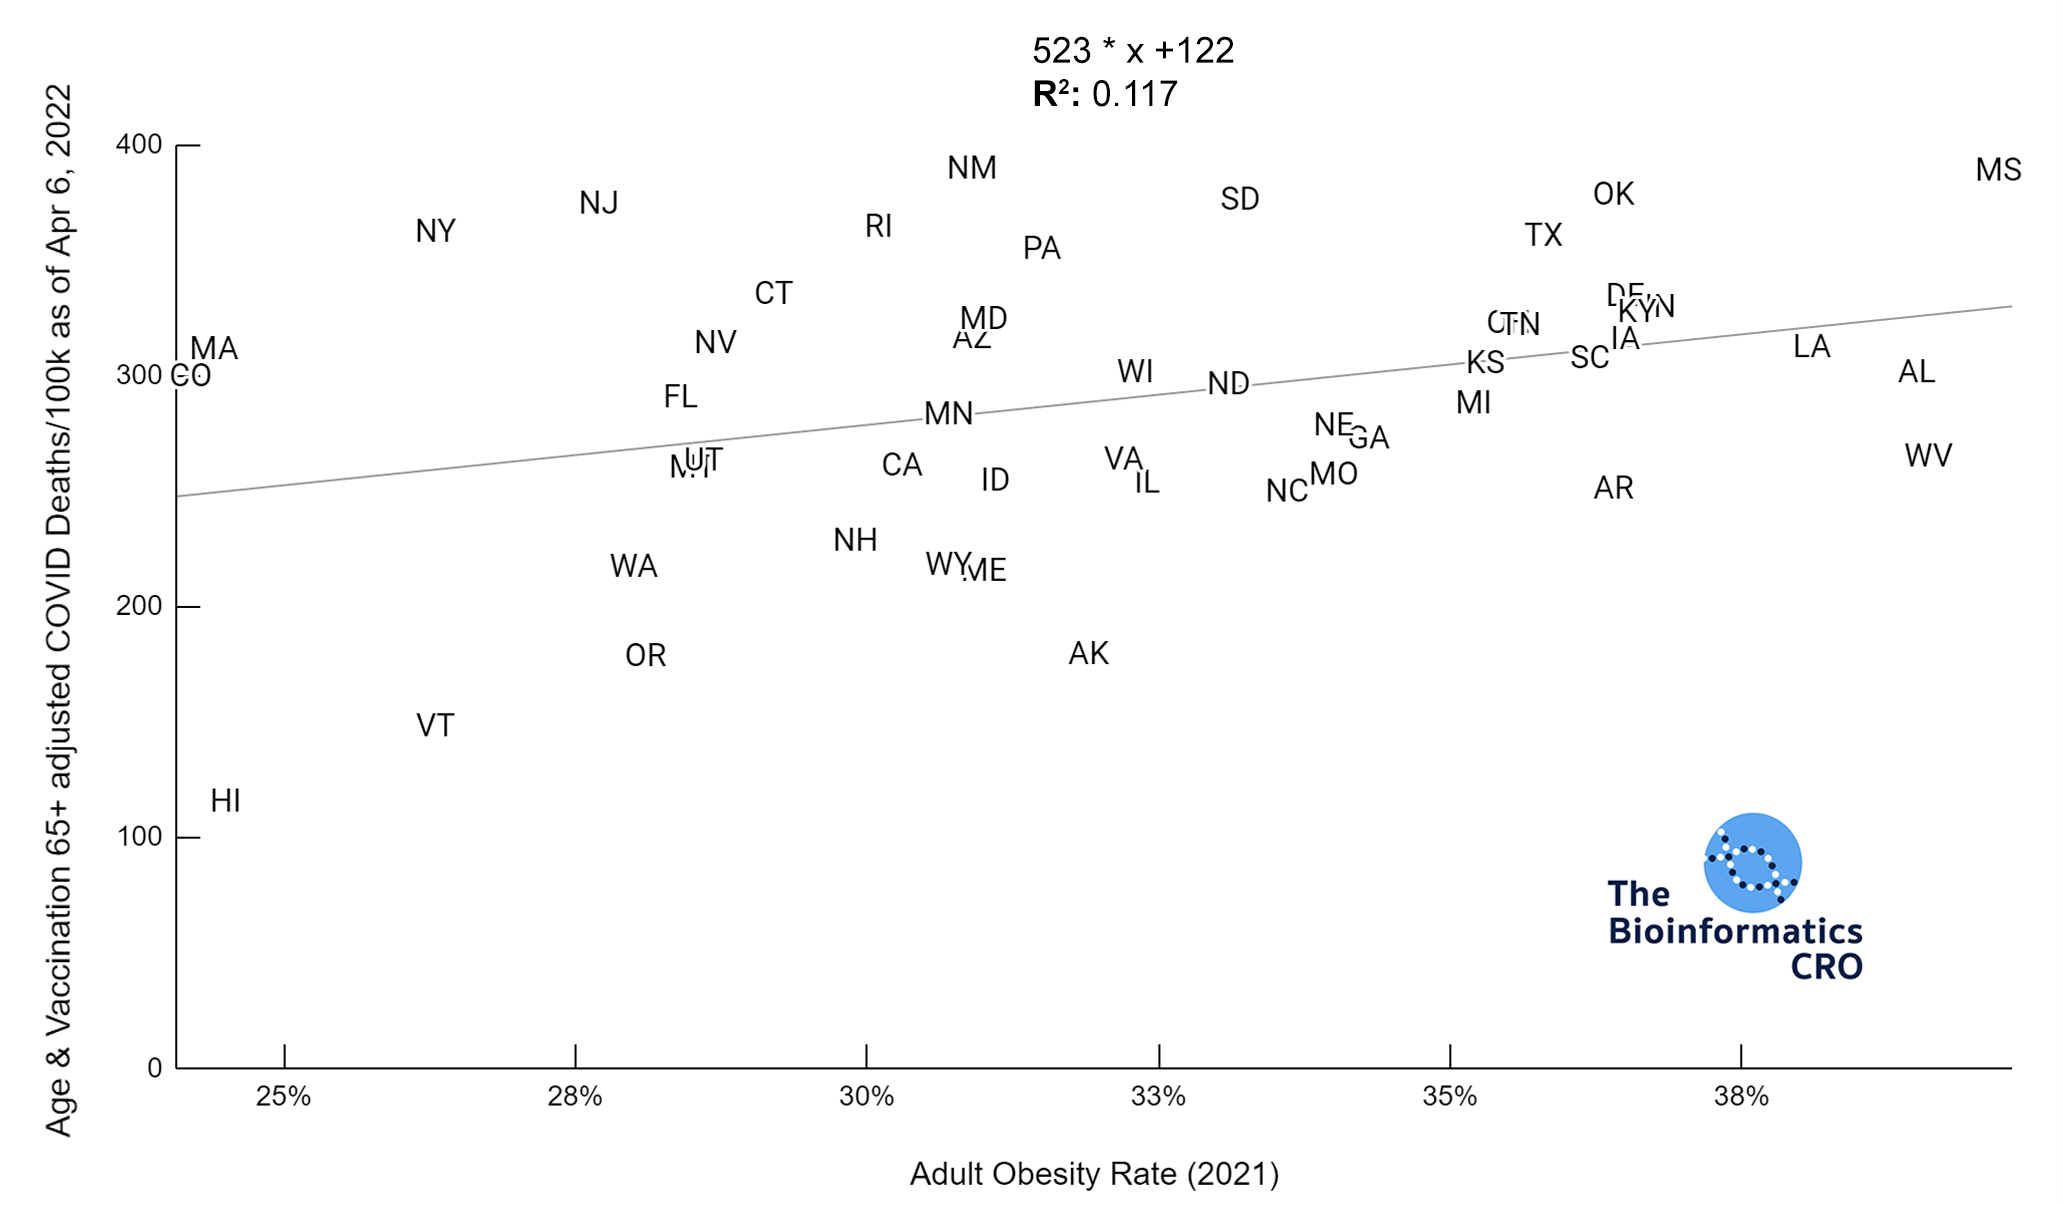
Obesity
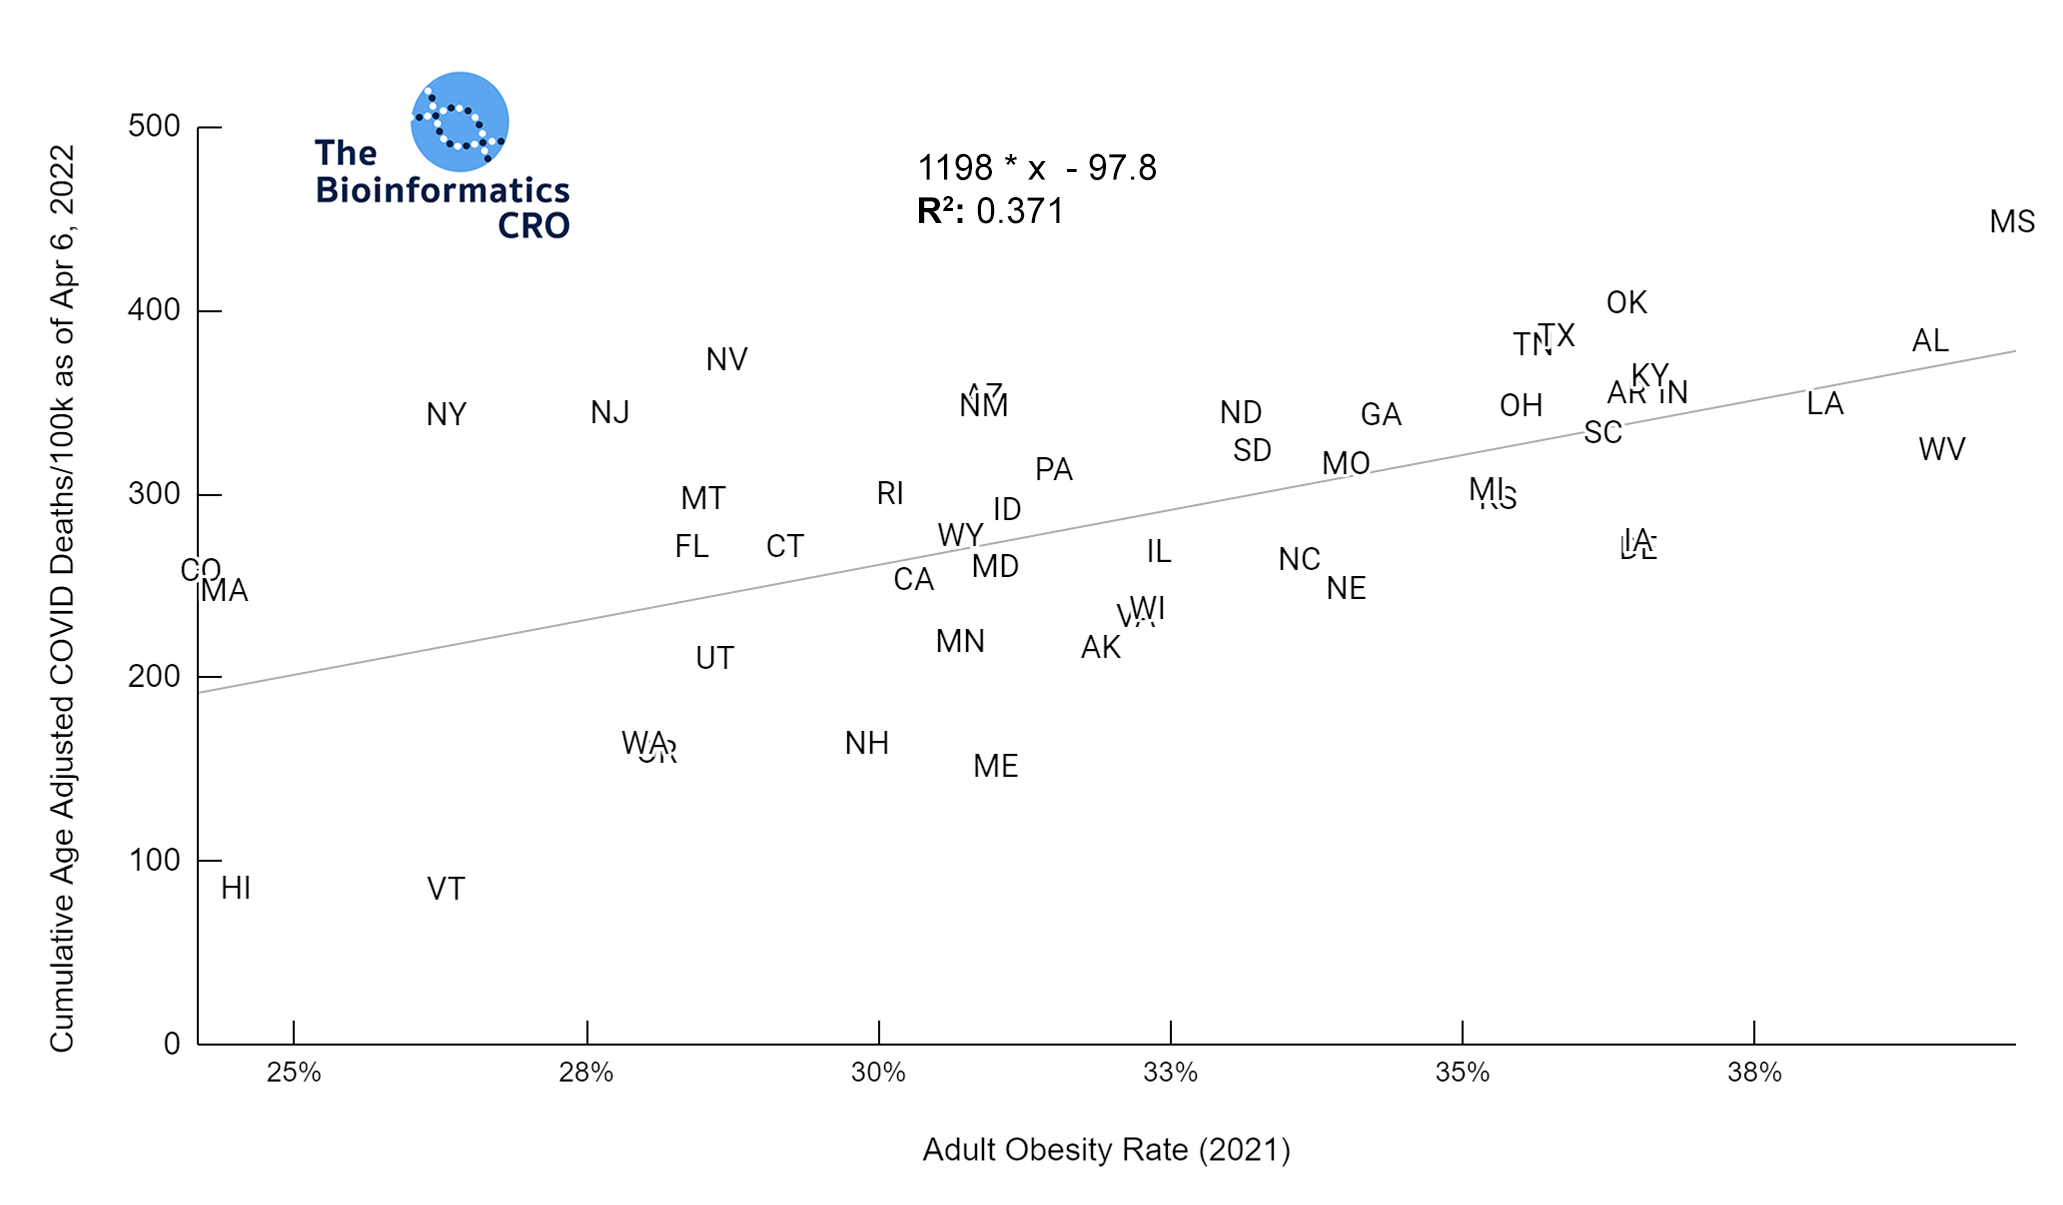
Our data show that adult obesity rate has a moderate positive correlation with age adjusted COVID deaths both before and after adjusting for vaccination status (P<0.01 and P<0.05 respectively). This is consistent with prior studies which identify obesity as a significant risk factor for death from COVID infection (OR = 1.61). However, the slope of these plots is a few fold higher than one would expect given the individual-level risks of obesity alone even after adjusting for age & vaccination, which suggests that state obesity rate may serve as a proxy for other population-level risk factors for COVID death.
Obesity and Age Adjusted COVID Deaths
Obesity and Age & Vaccination 65+ Adjusted COVID Deaths
Poverty & Income Inequality
The Gini Index represents the degree of inequality in the distribution of income in a particular location. It’s value ranges from 0 to 1 with higher values indicating greater income inequality. You can find a more detailed explanation of its calculation here. The charts below show a significant (P<0.01) positive correlation between income inequality and age-adjusted COVID deaths, even after adjusting for obesity and vaccination.
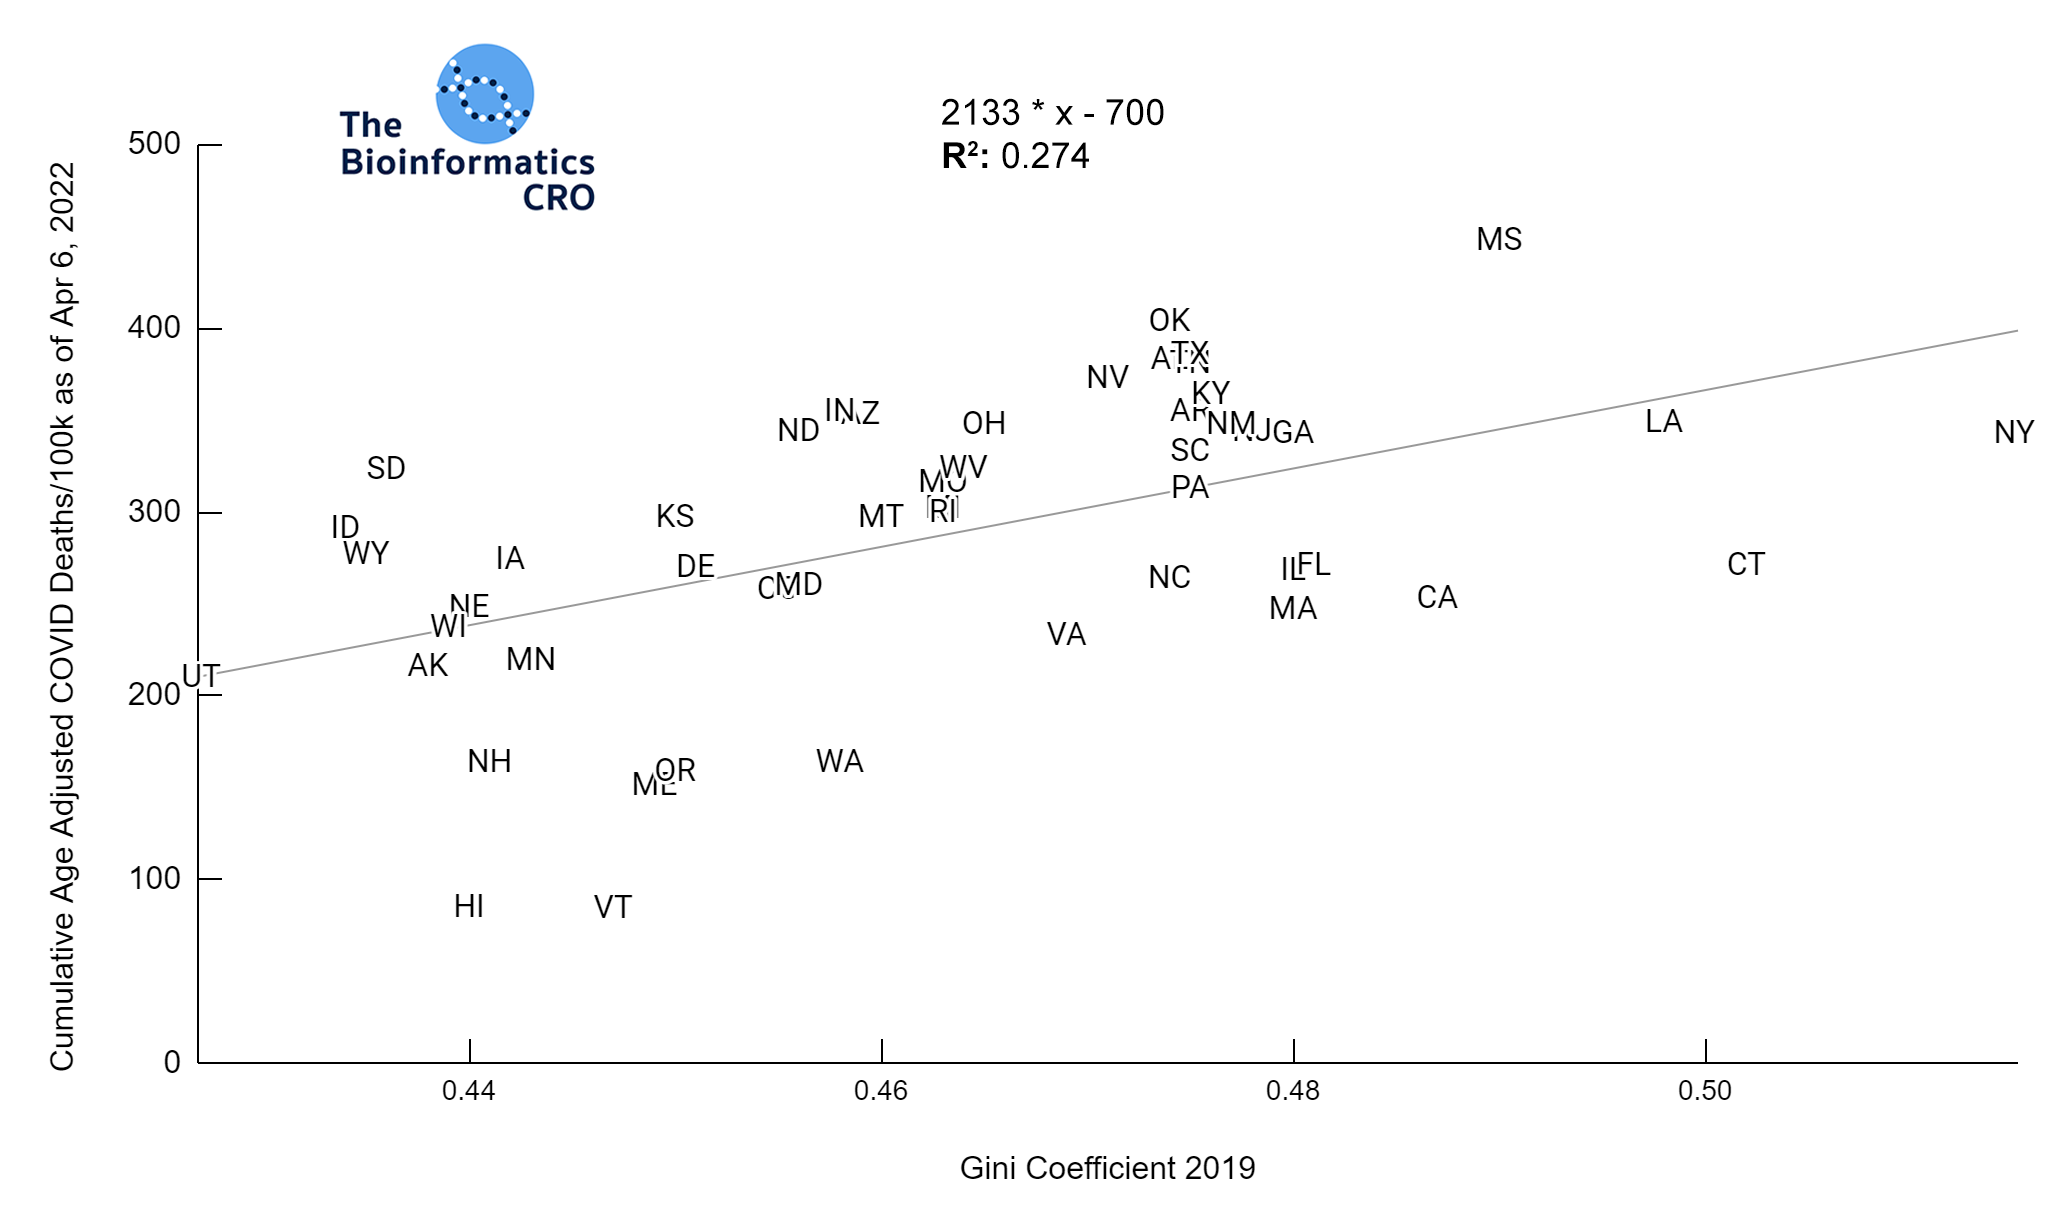
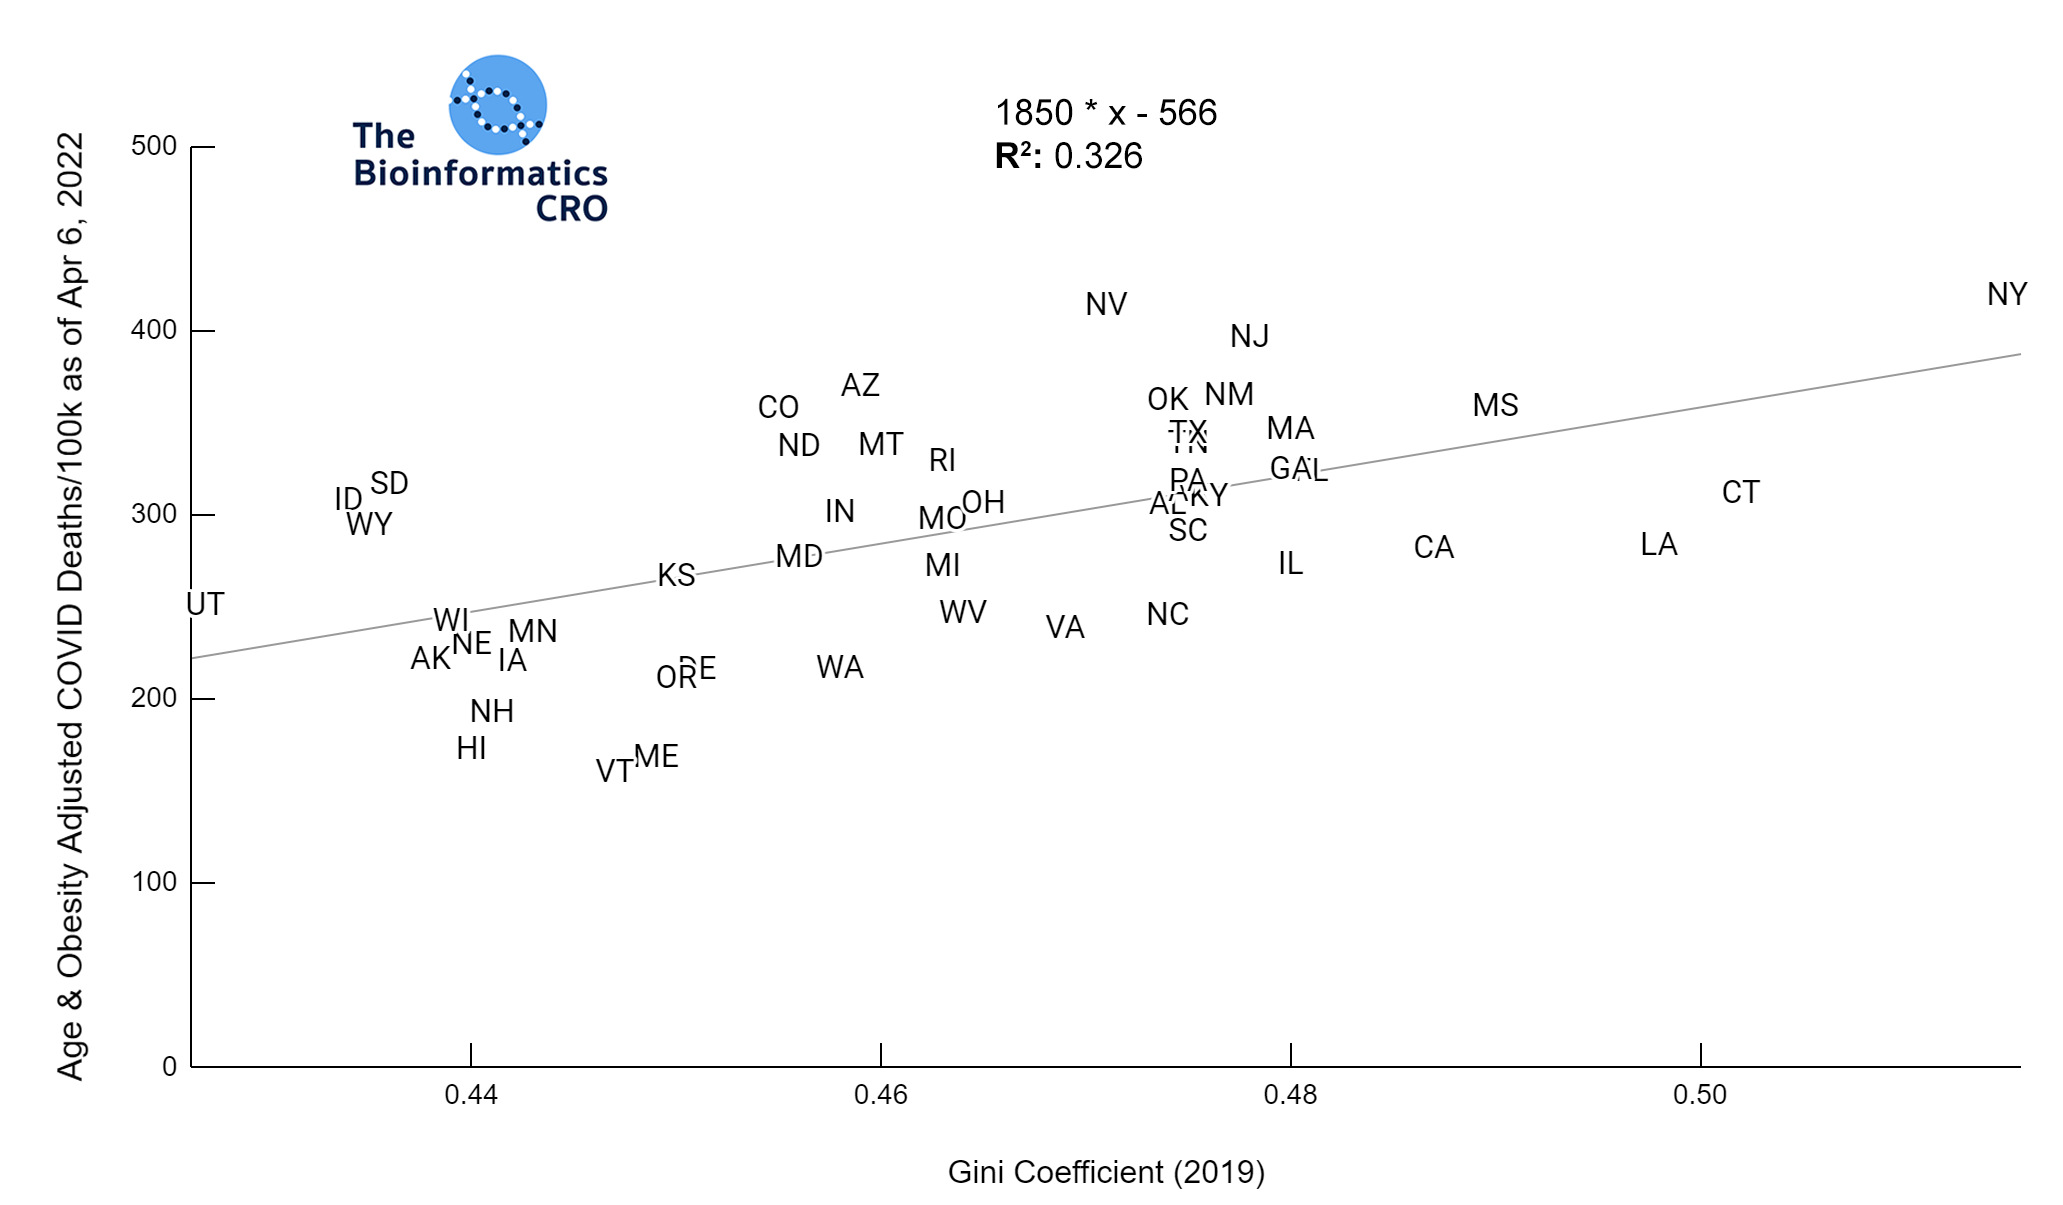
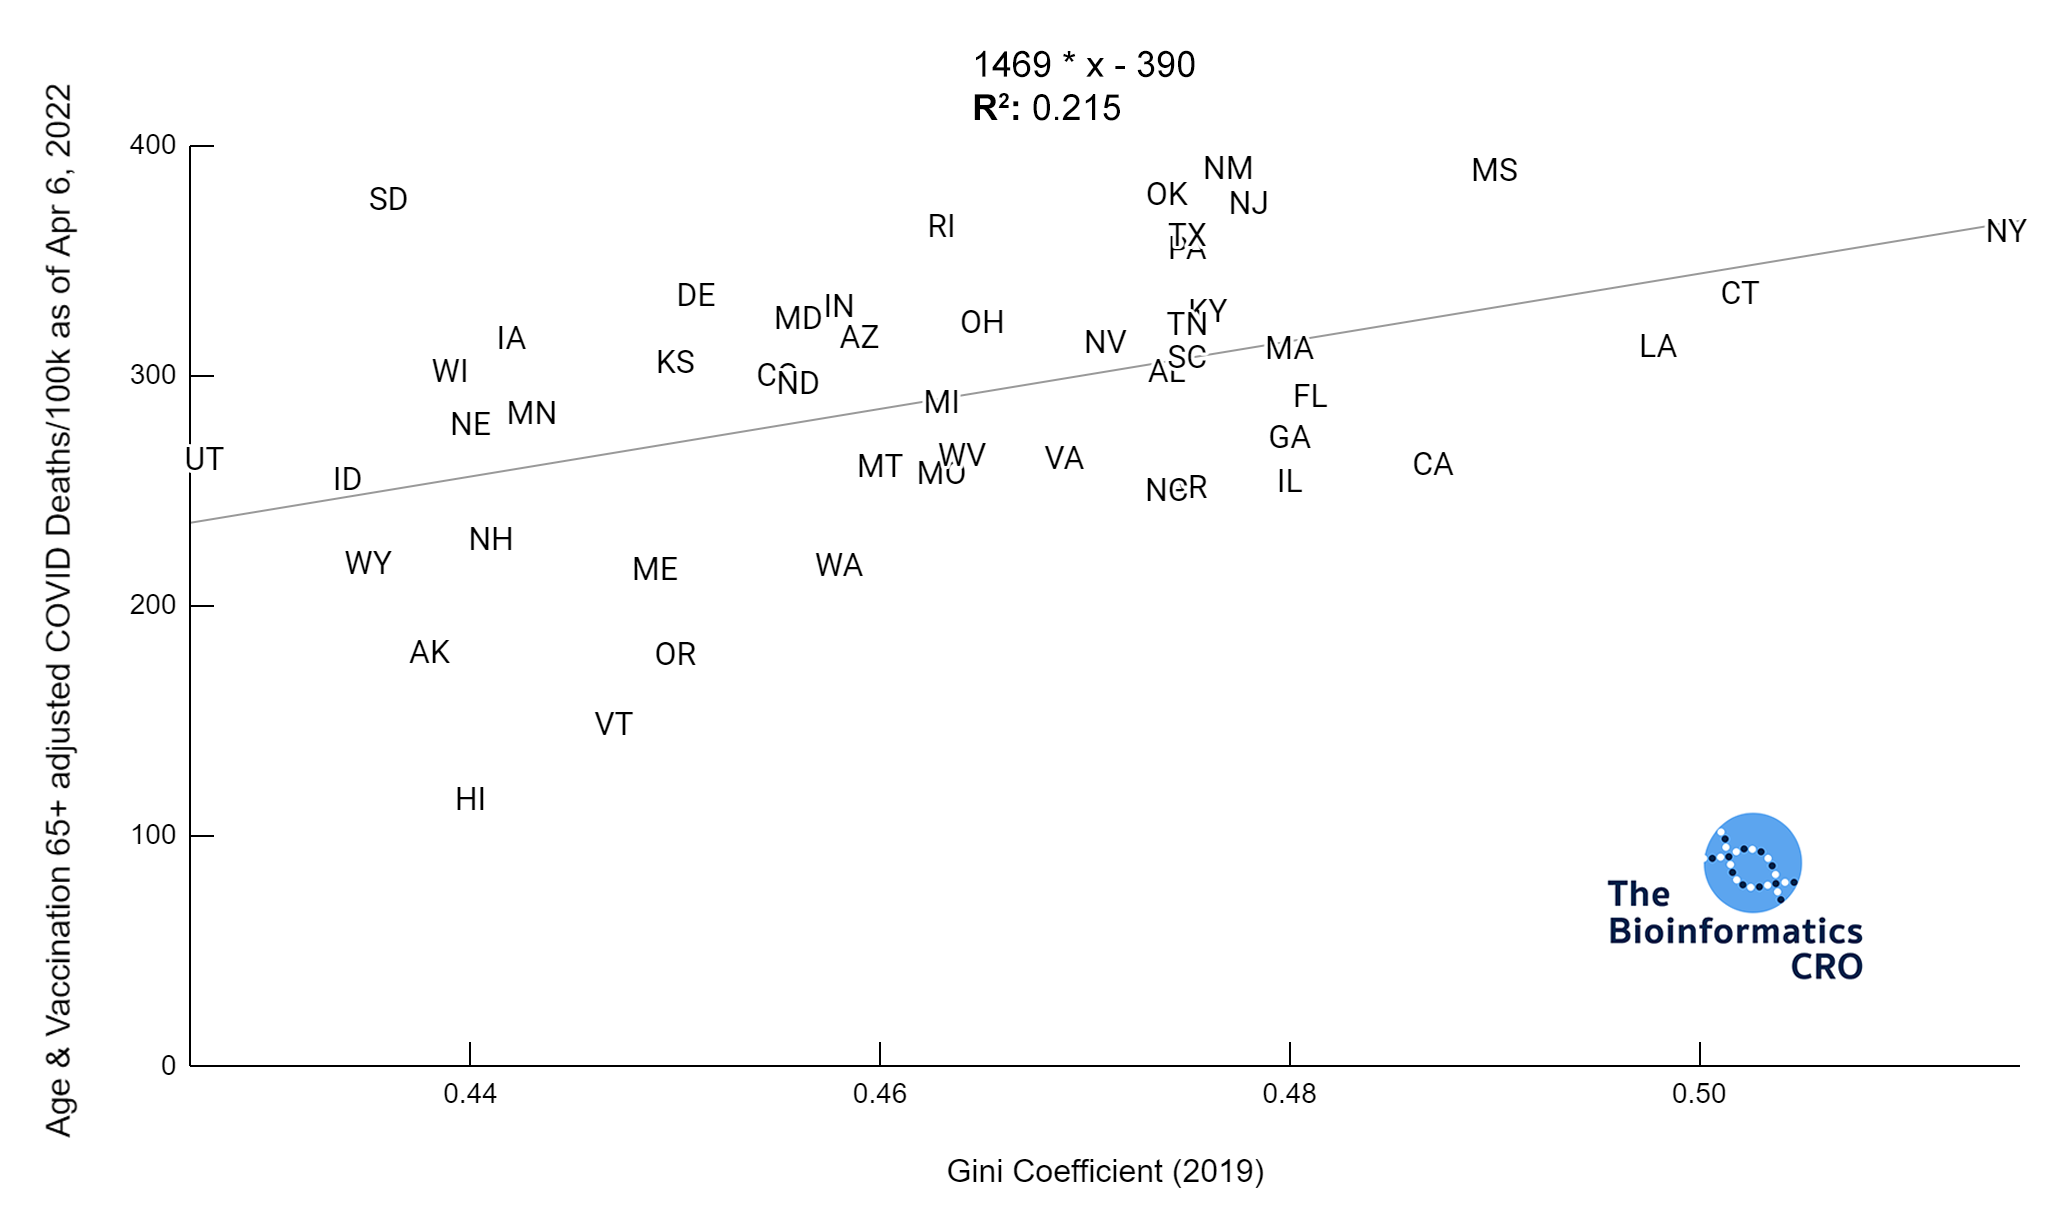
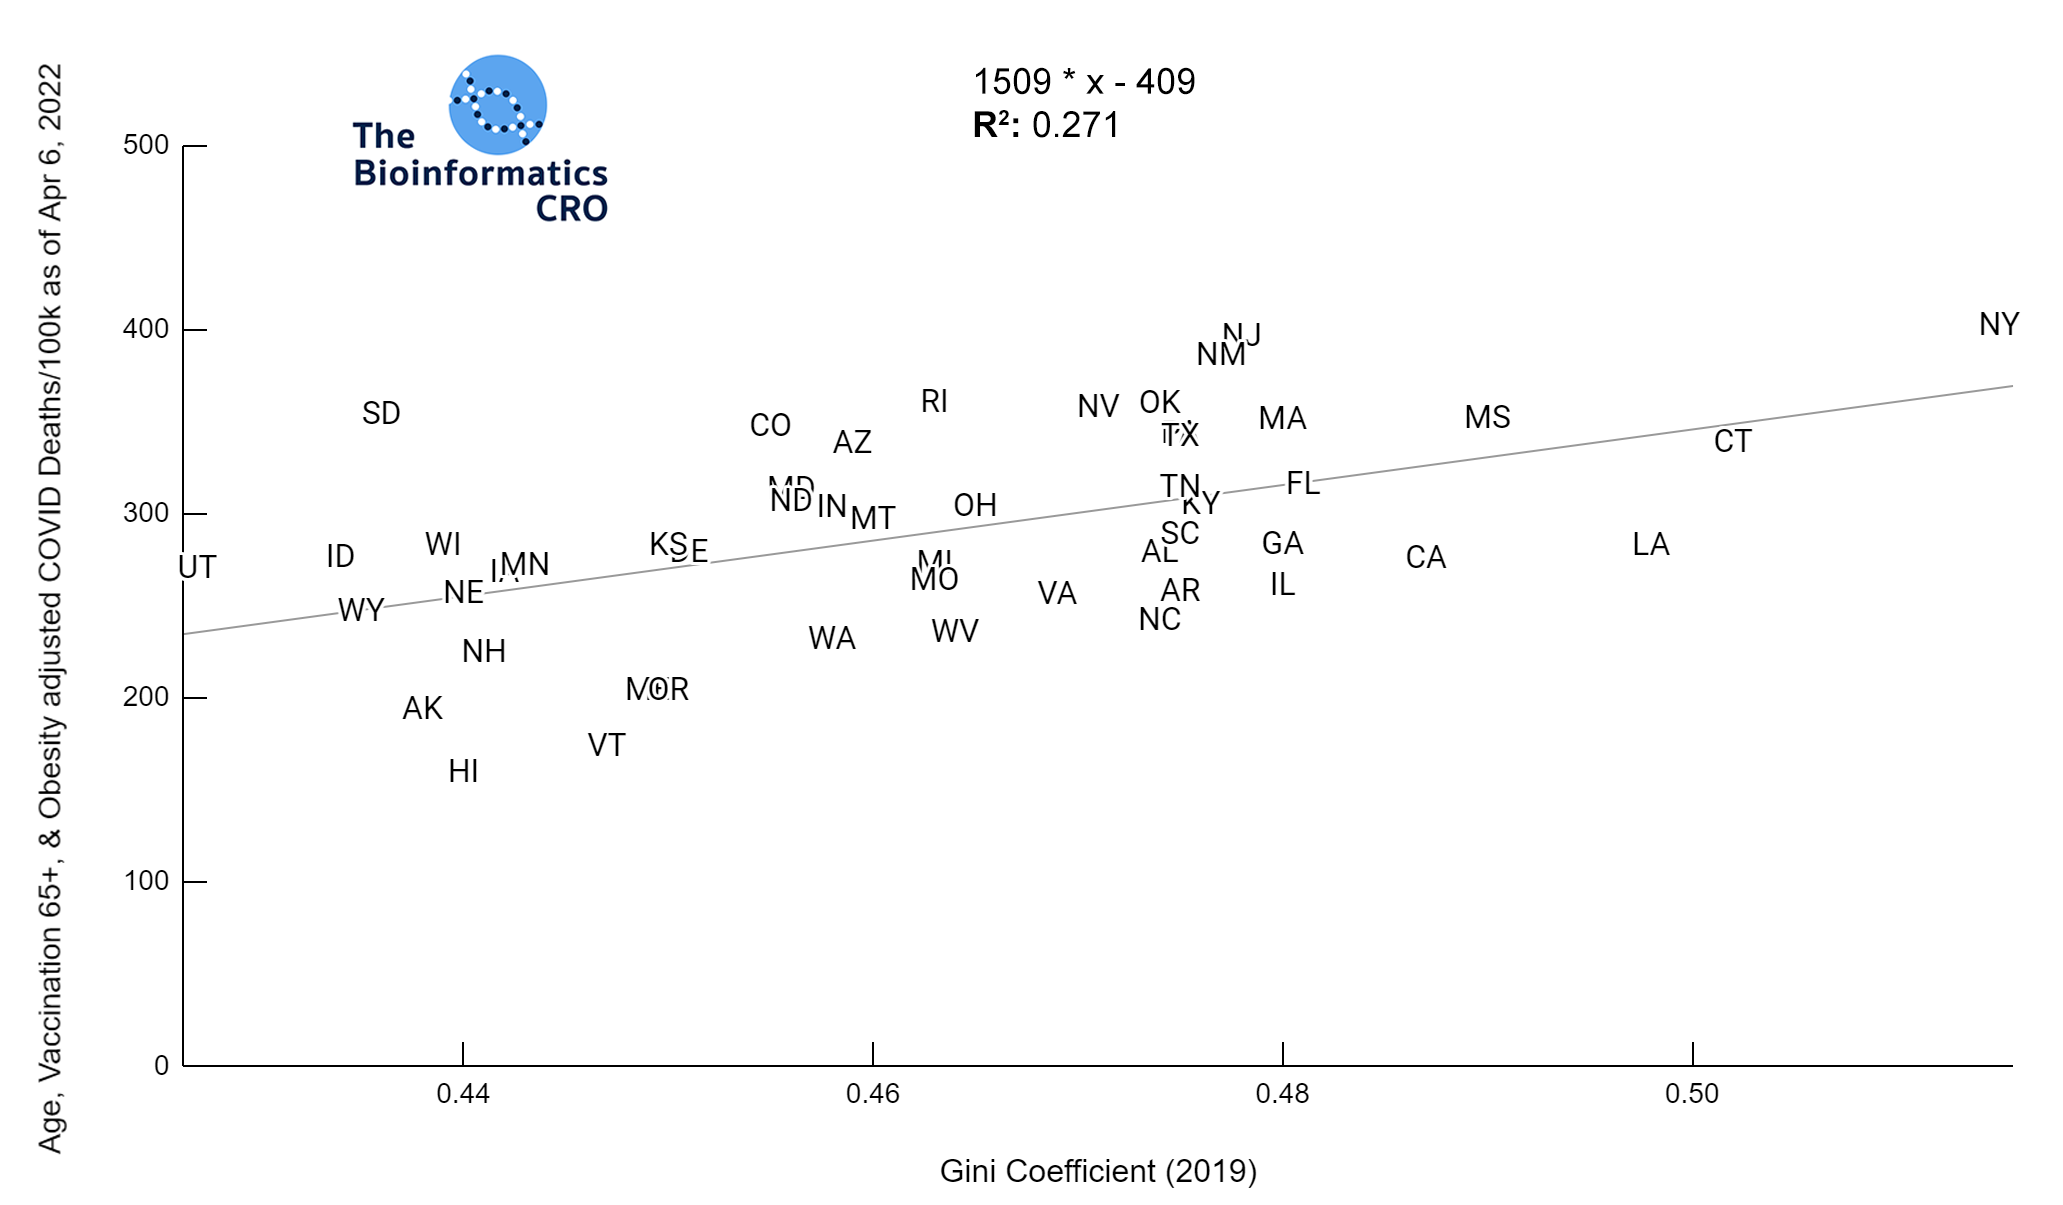
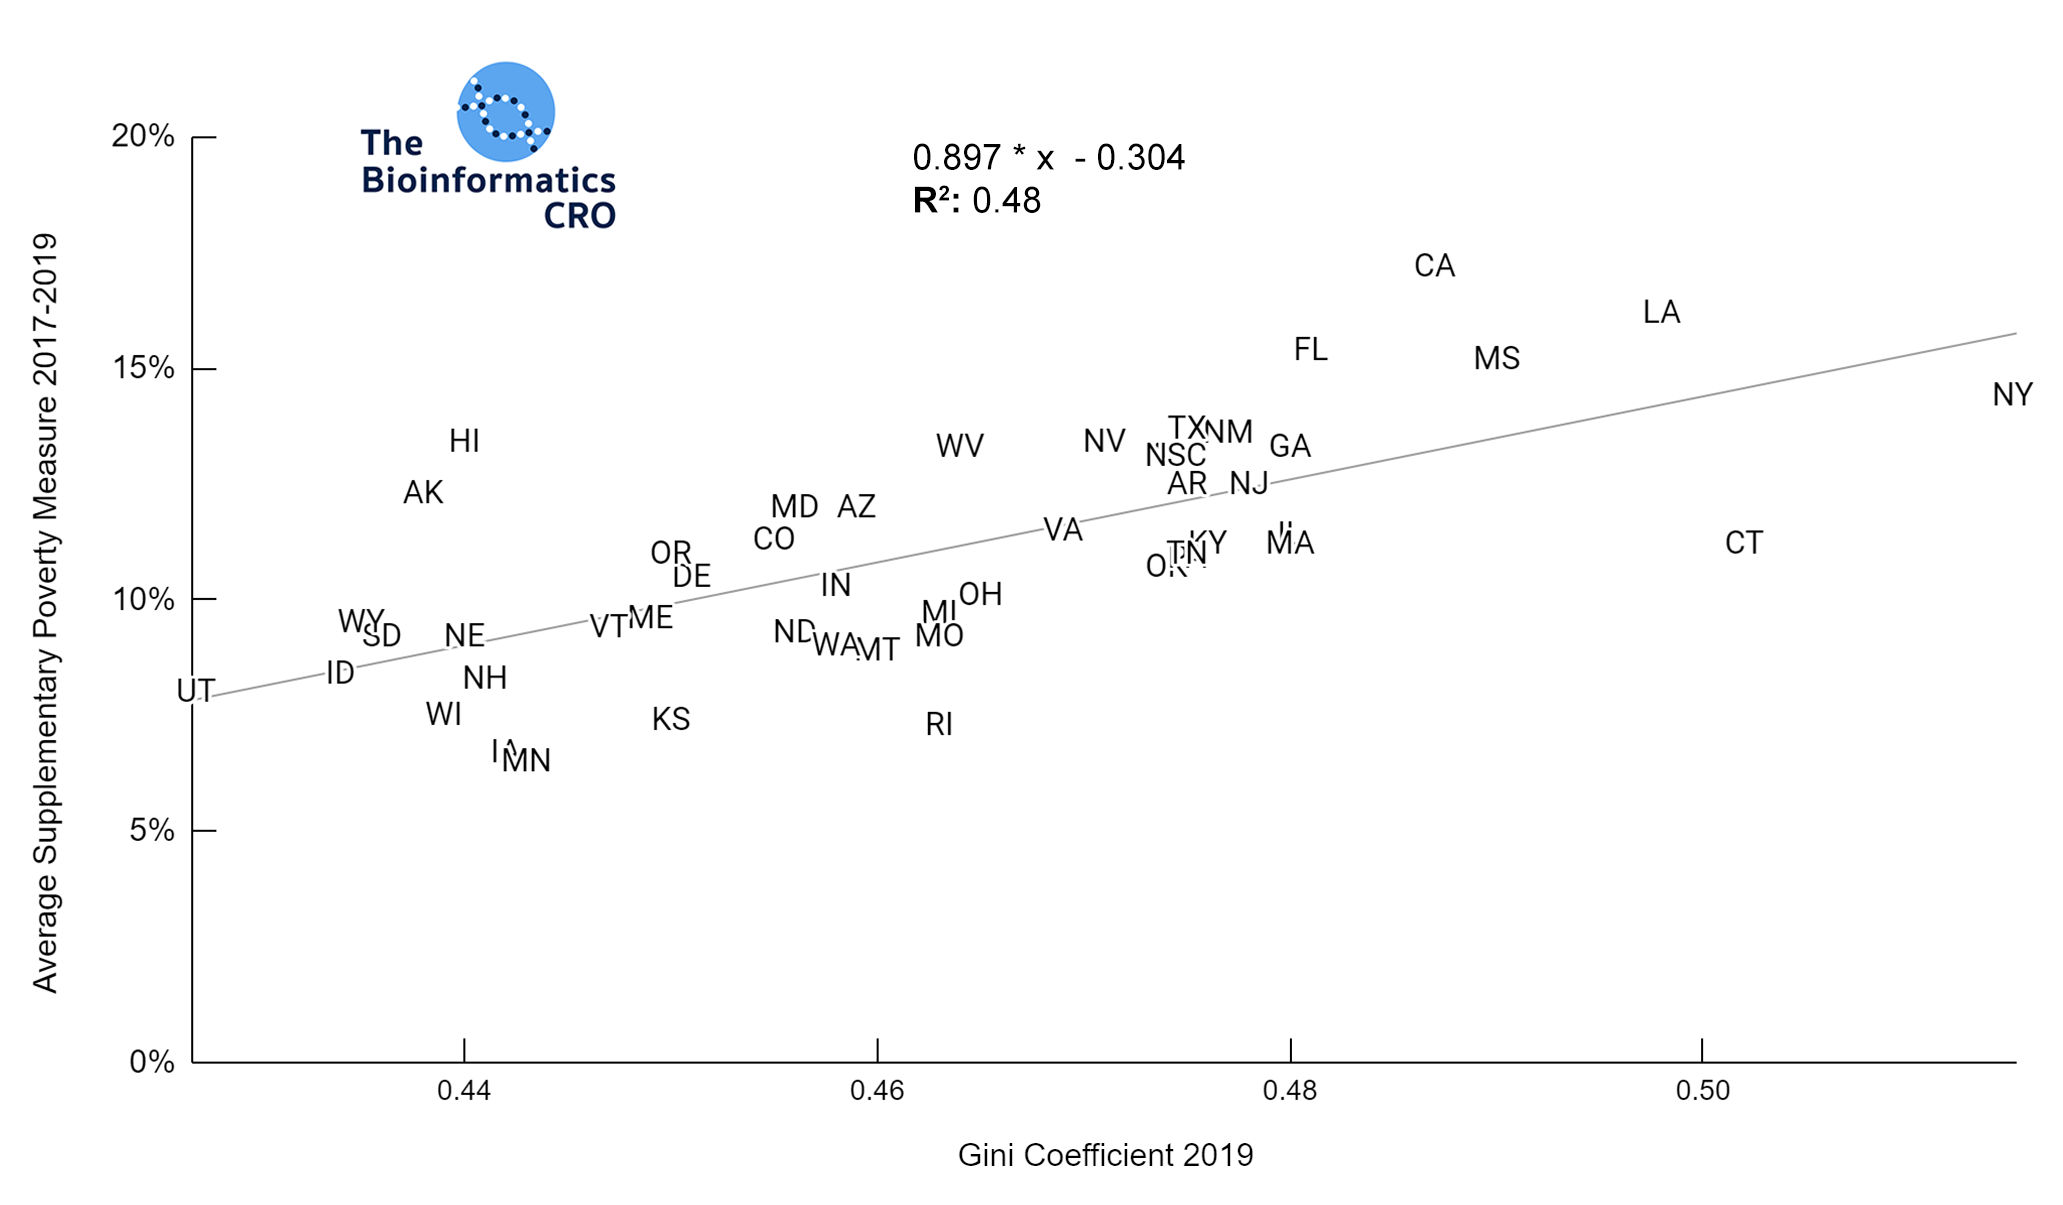
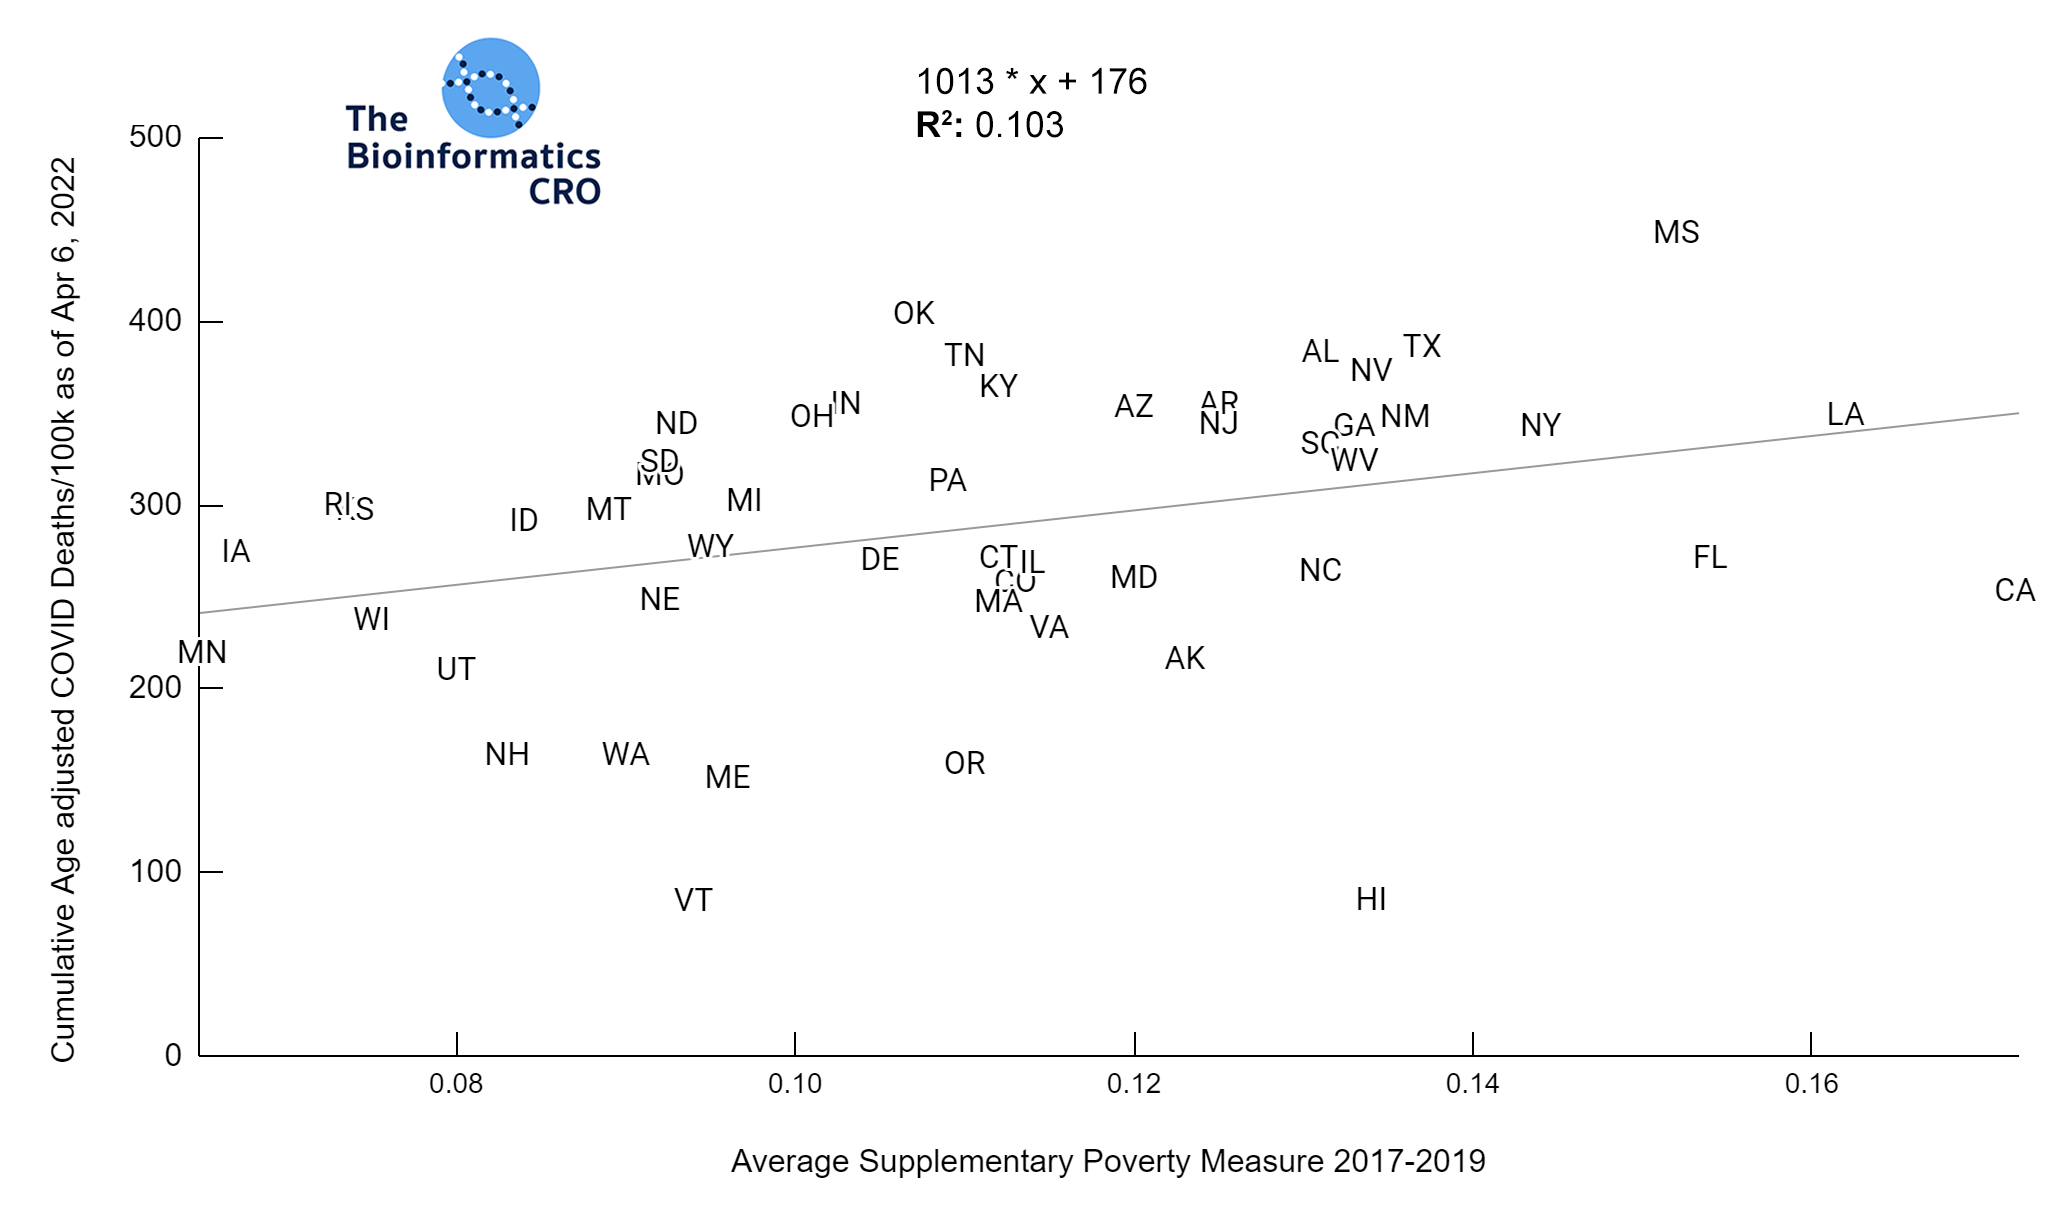
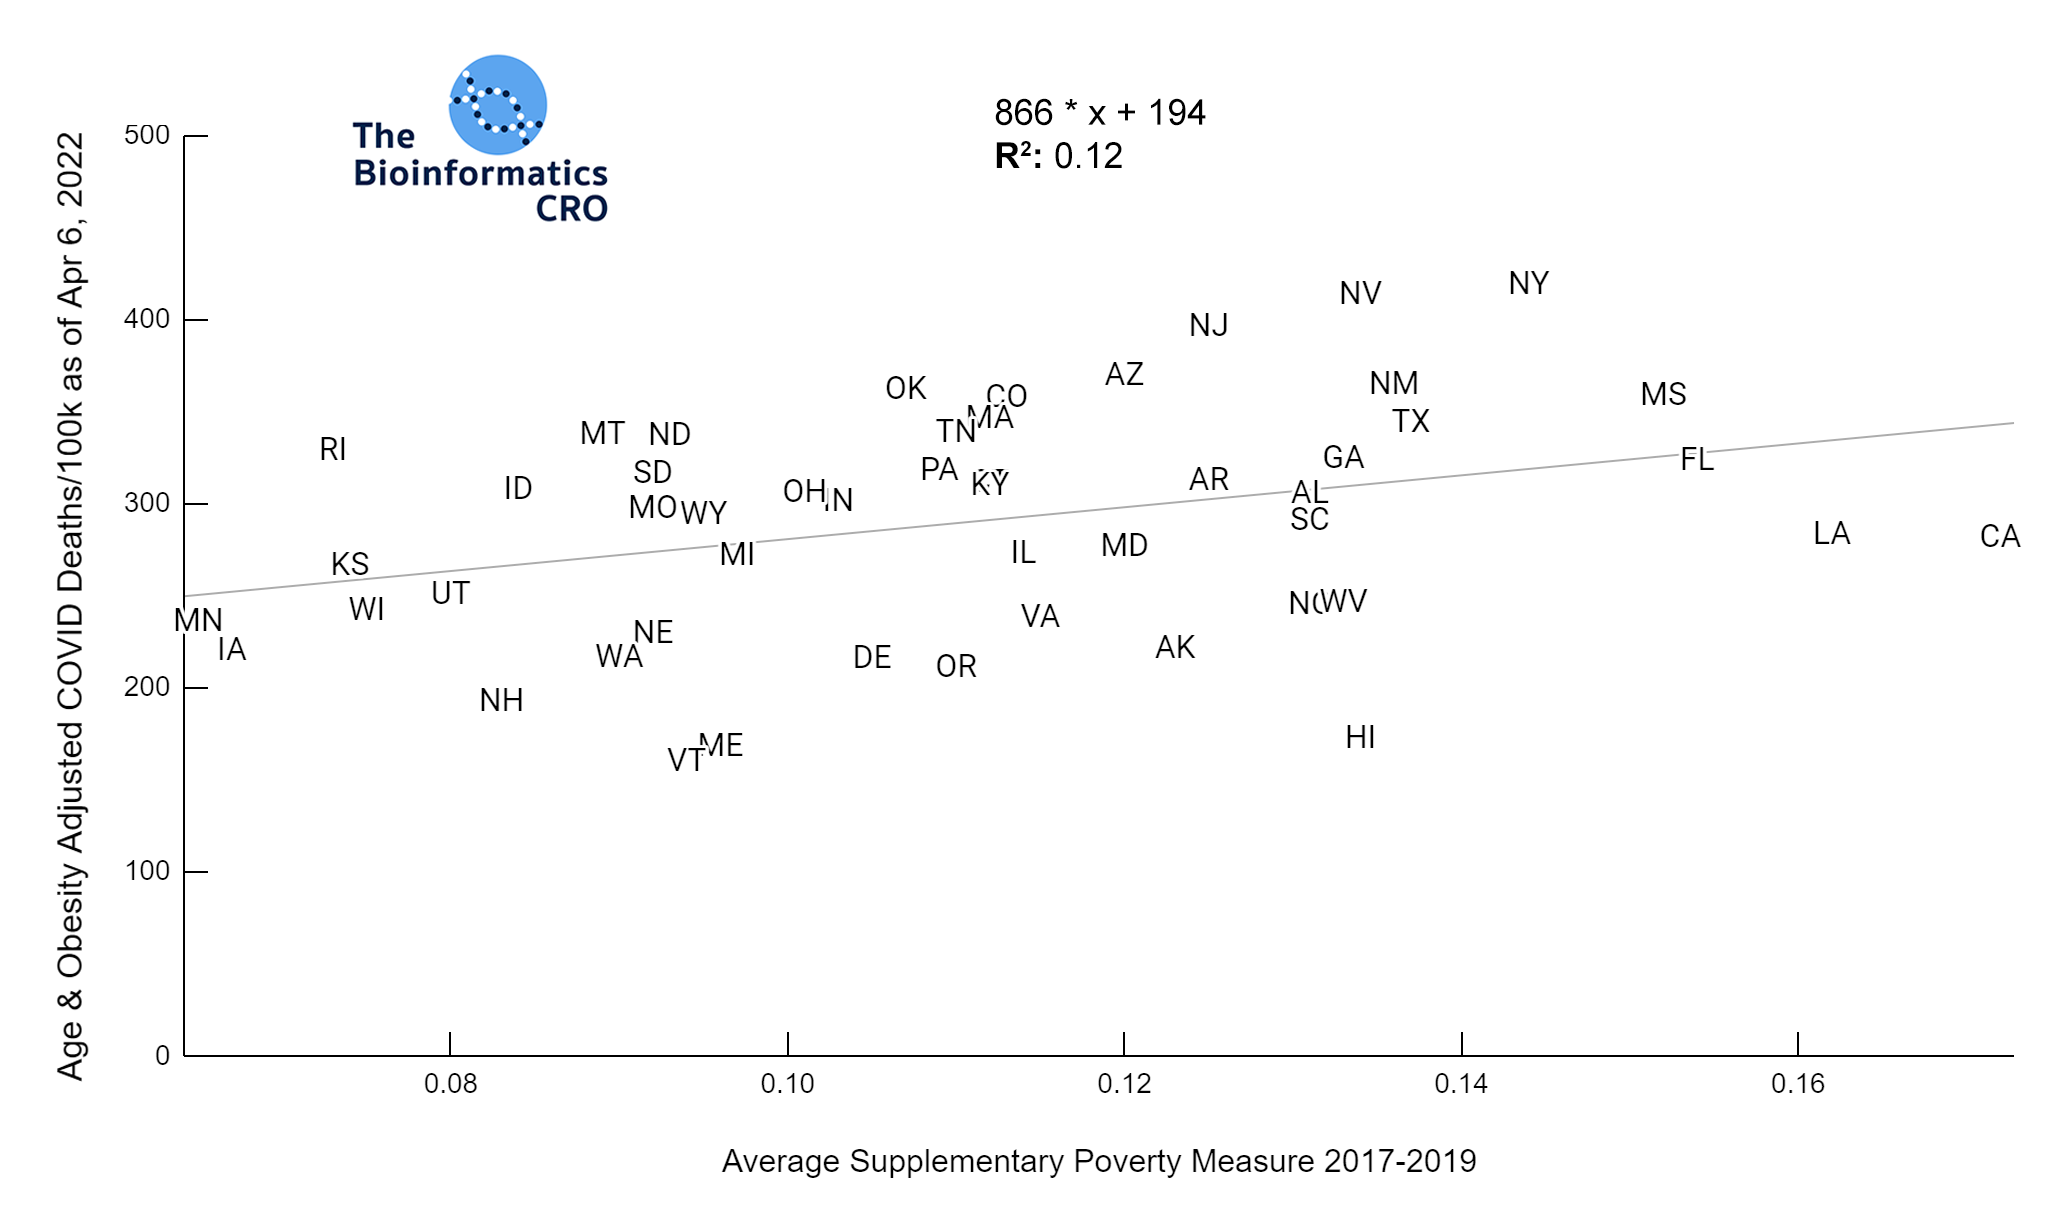
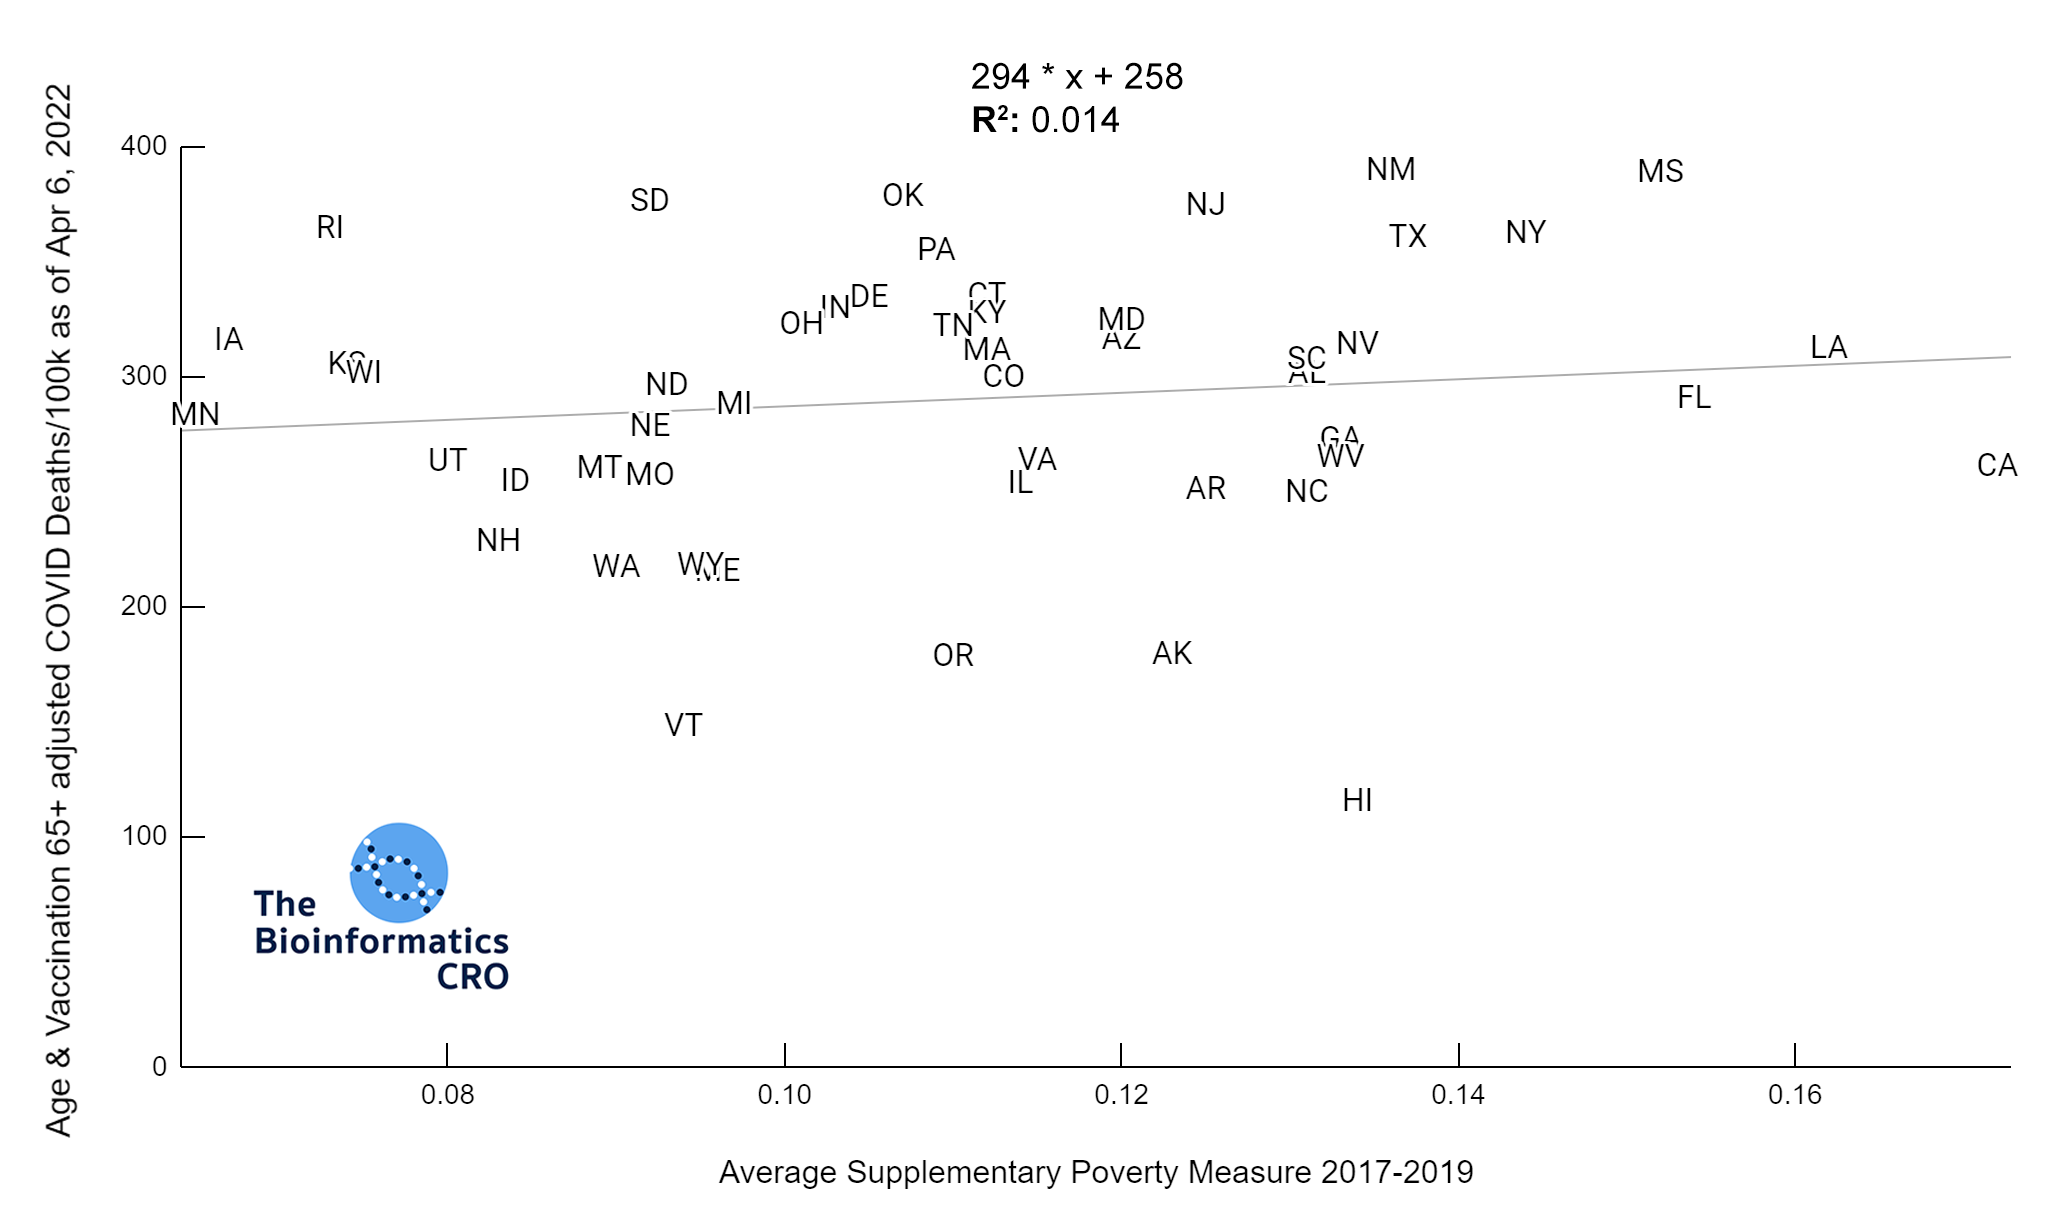
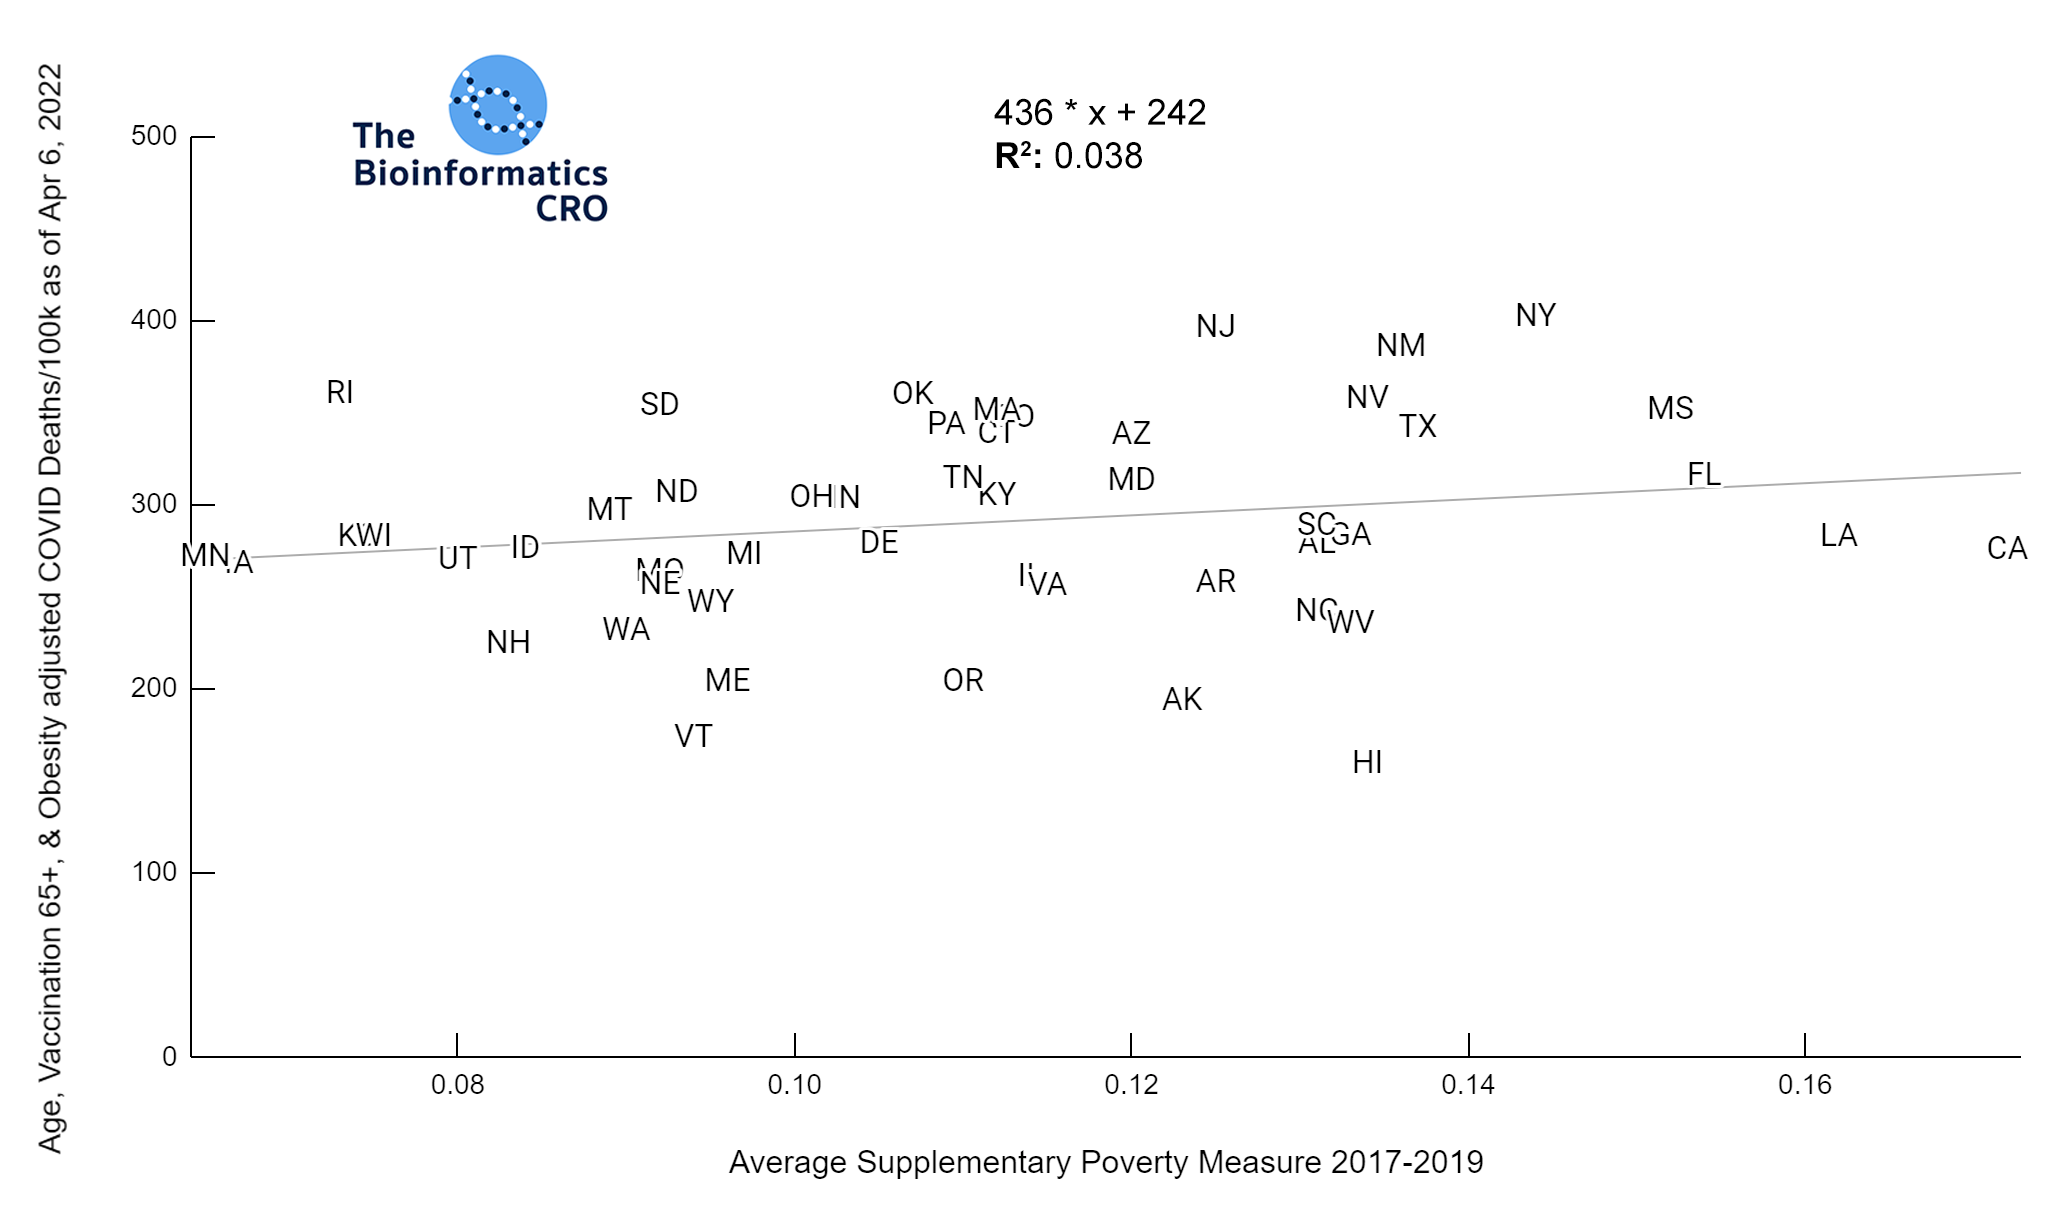
We also examined the poverty rate, using the supplementary poverty measure (SPM). The SPM takes into account differences in regional cost of living as well as taxes and the value of government assistance programs. Click here for more information about its calculation and comparison to the official poverty measure. Although Gini Index and the SPM are highly correlated with one another, it appears that Gini Index demonstrates a higher correlation with COVID mortality, especially after adjusting for vaccination and obesity.
Partisanship
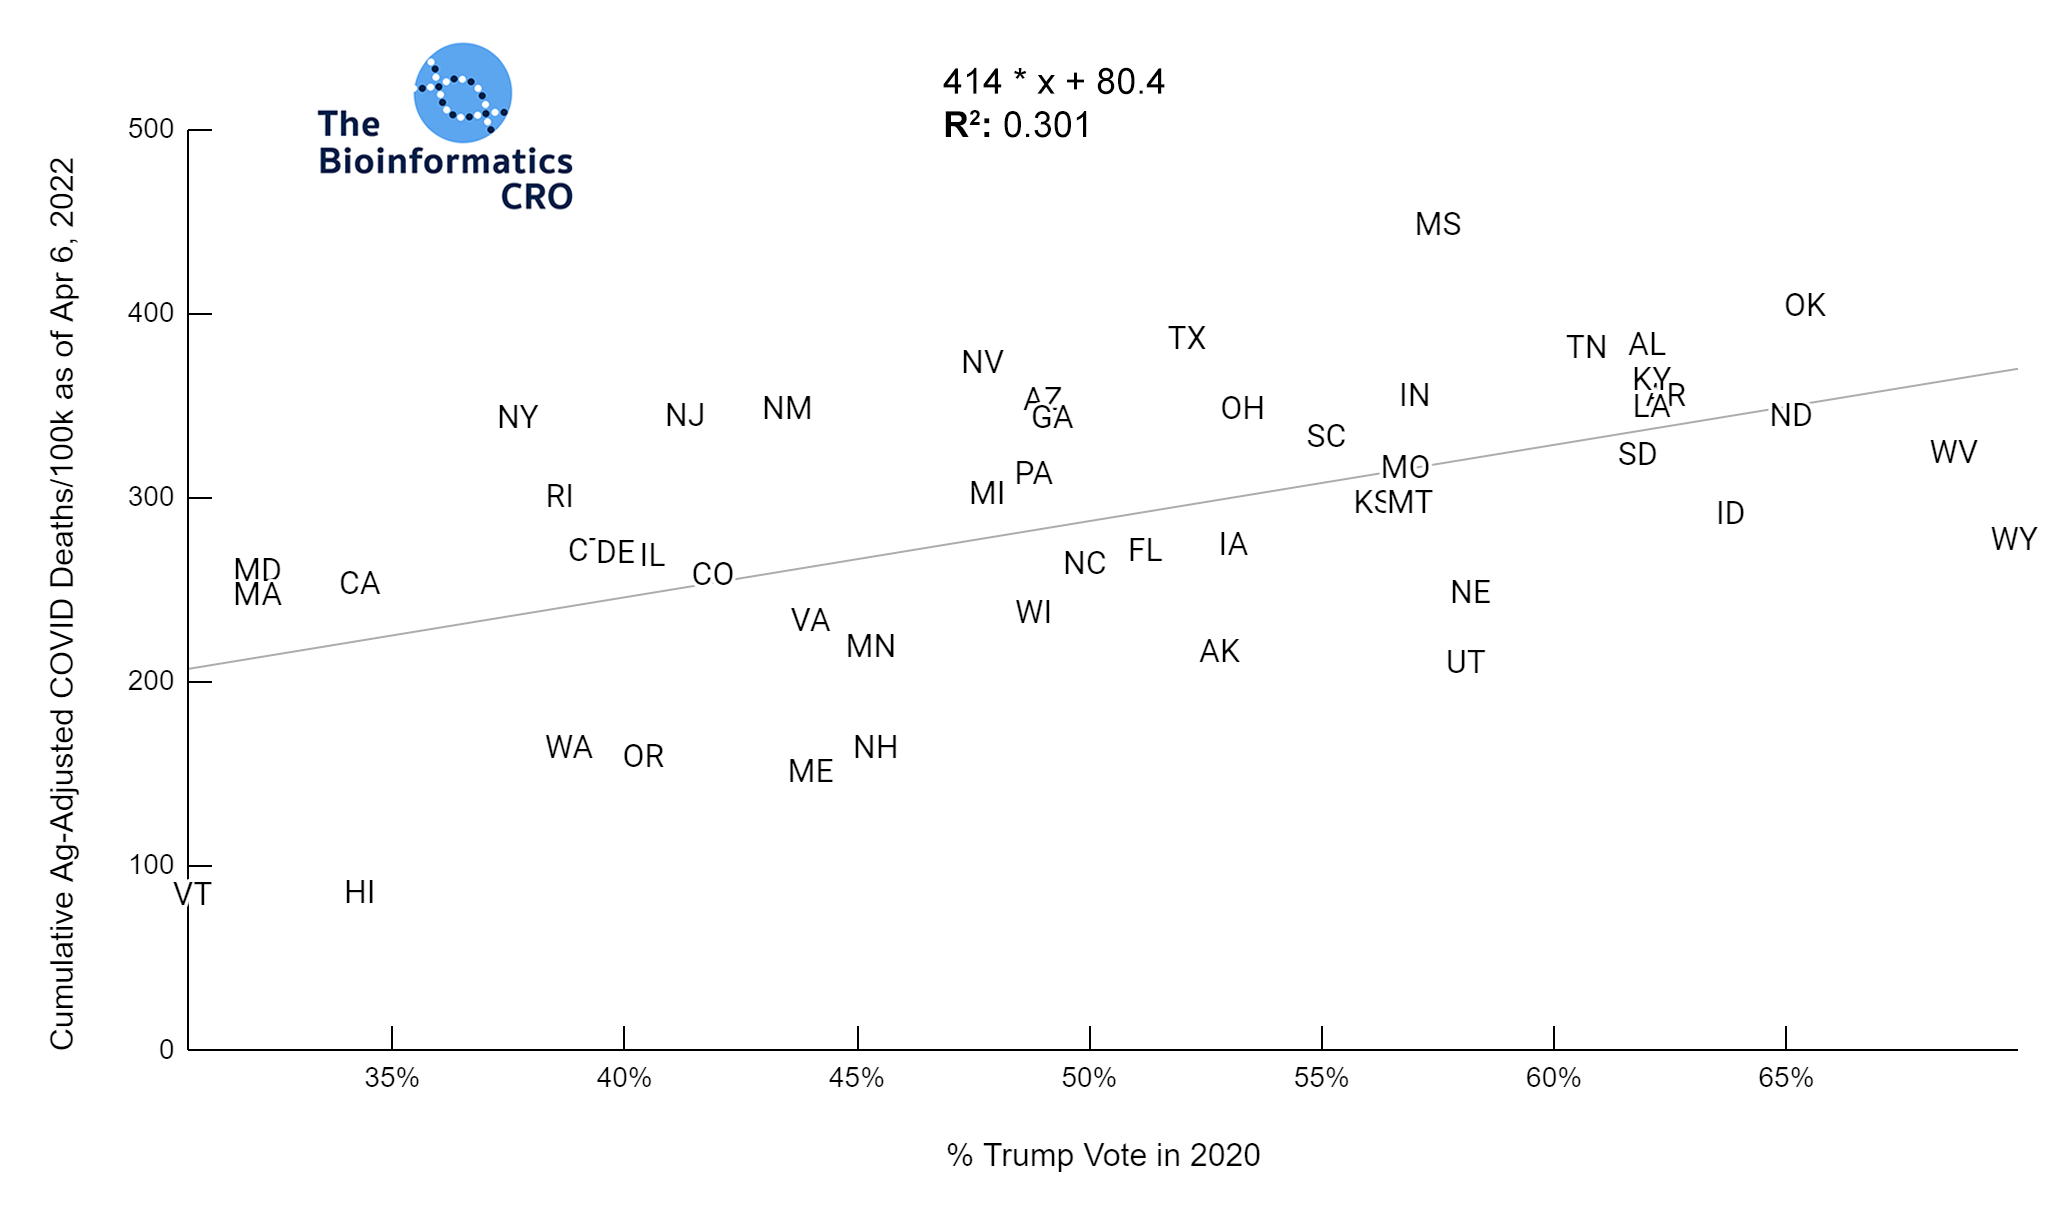
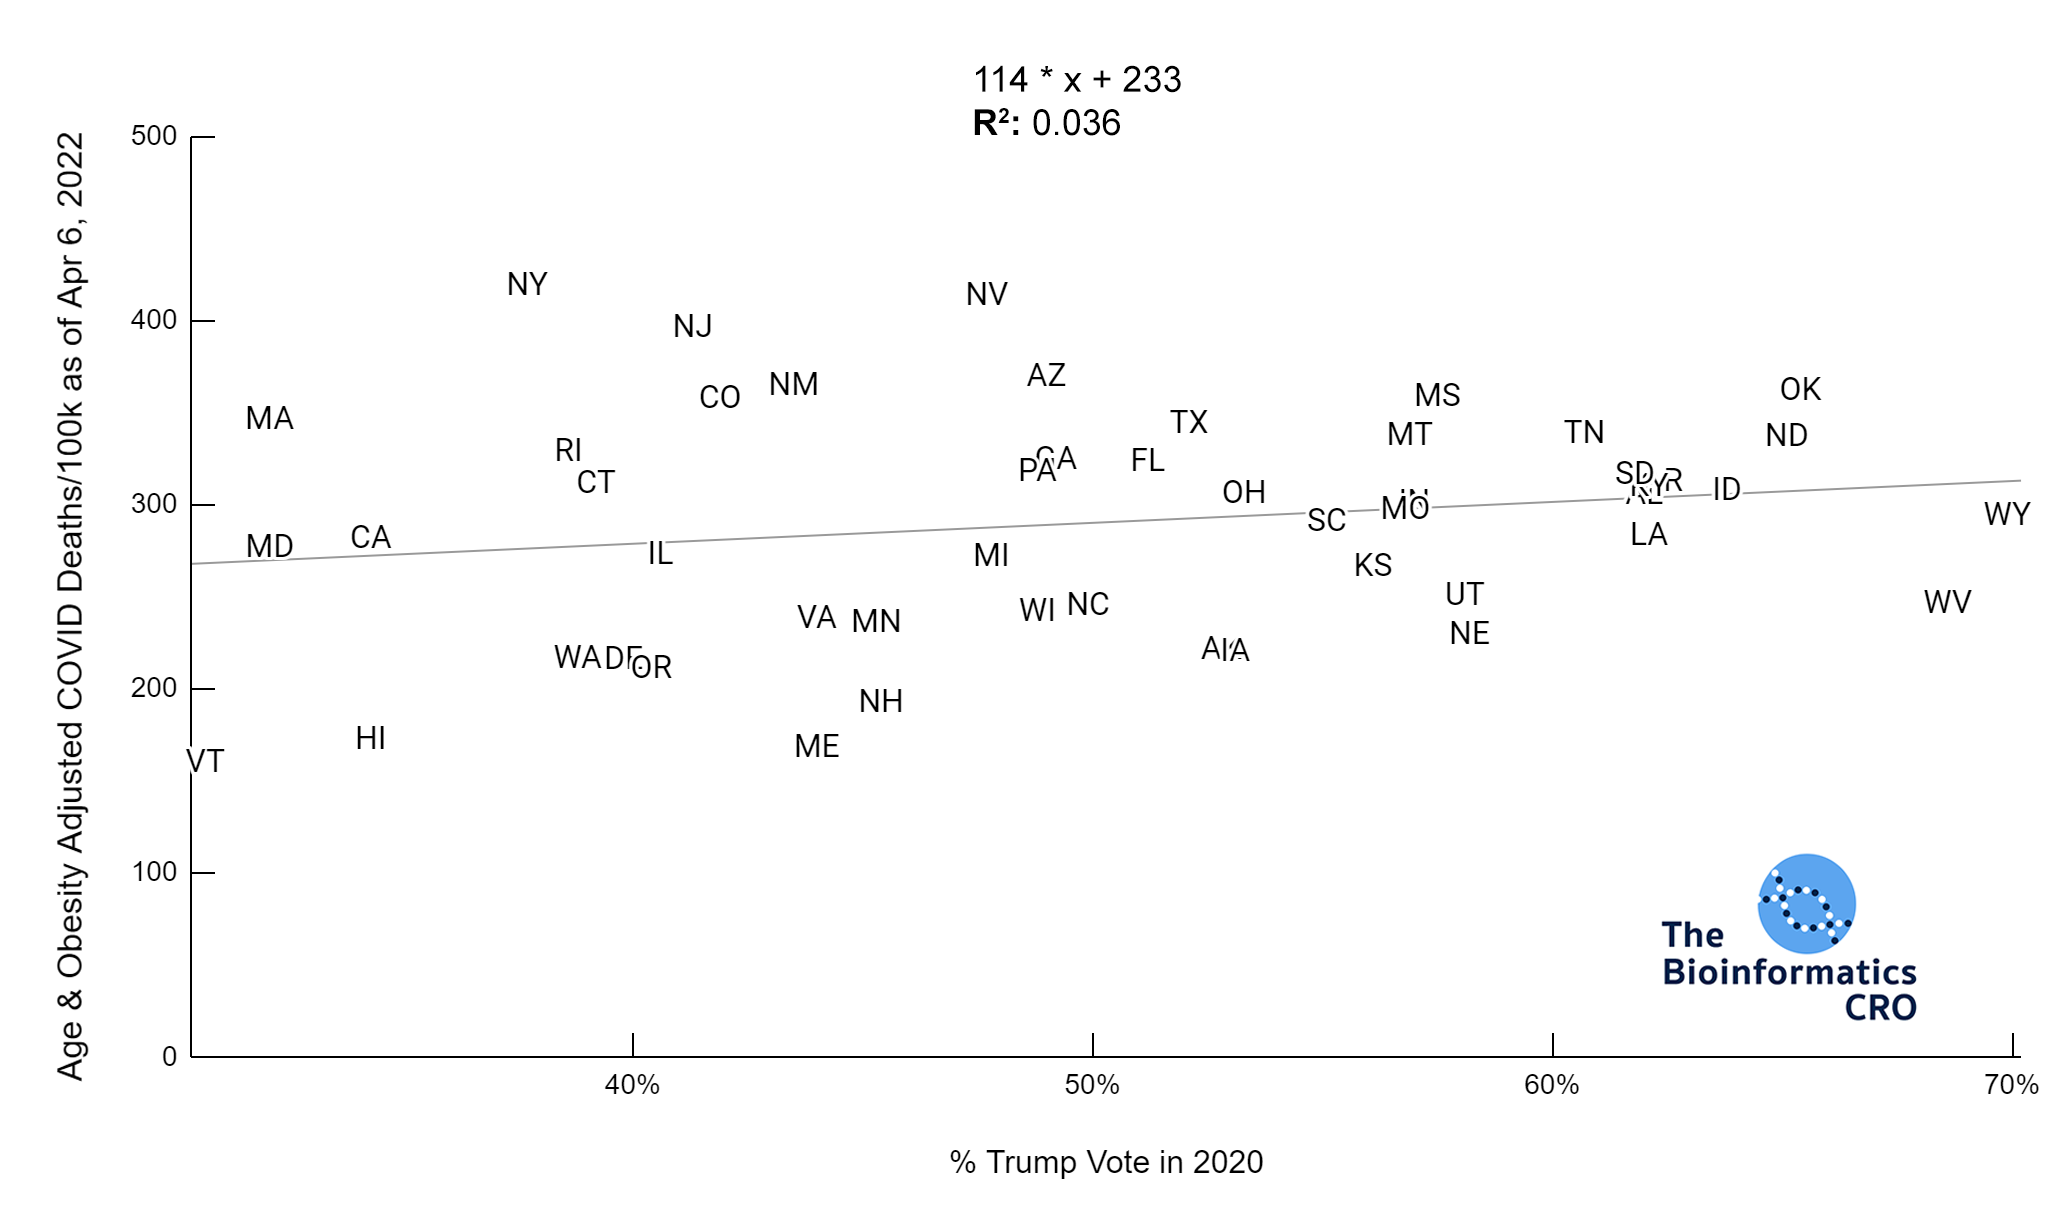
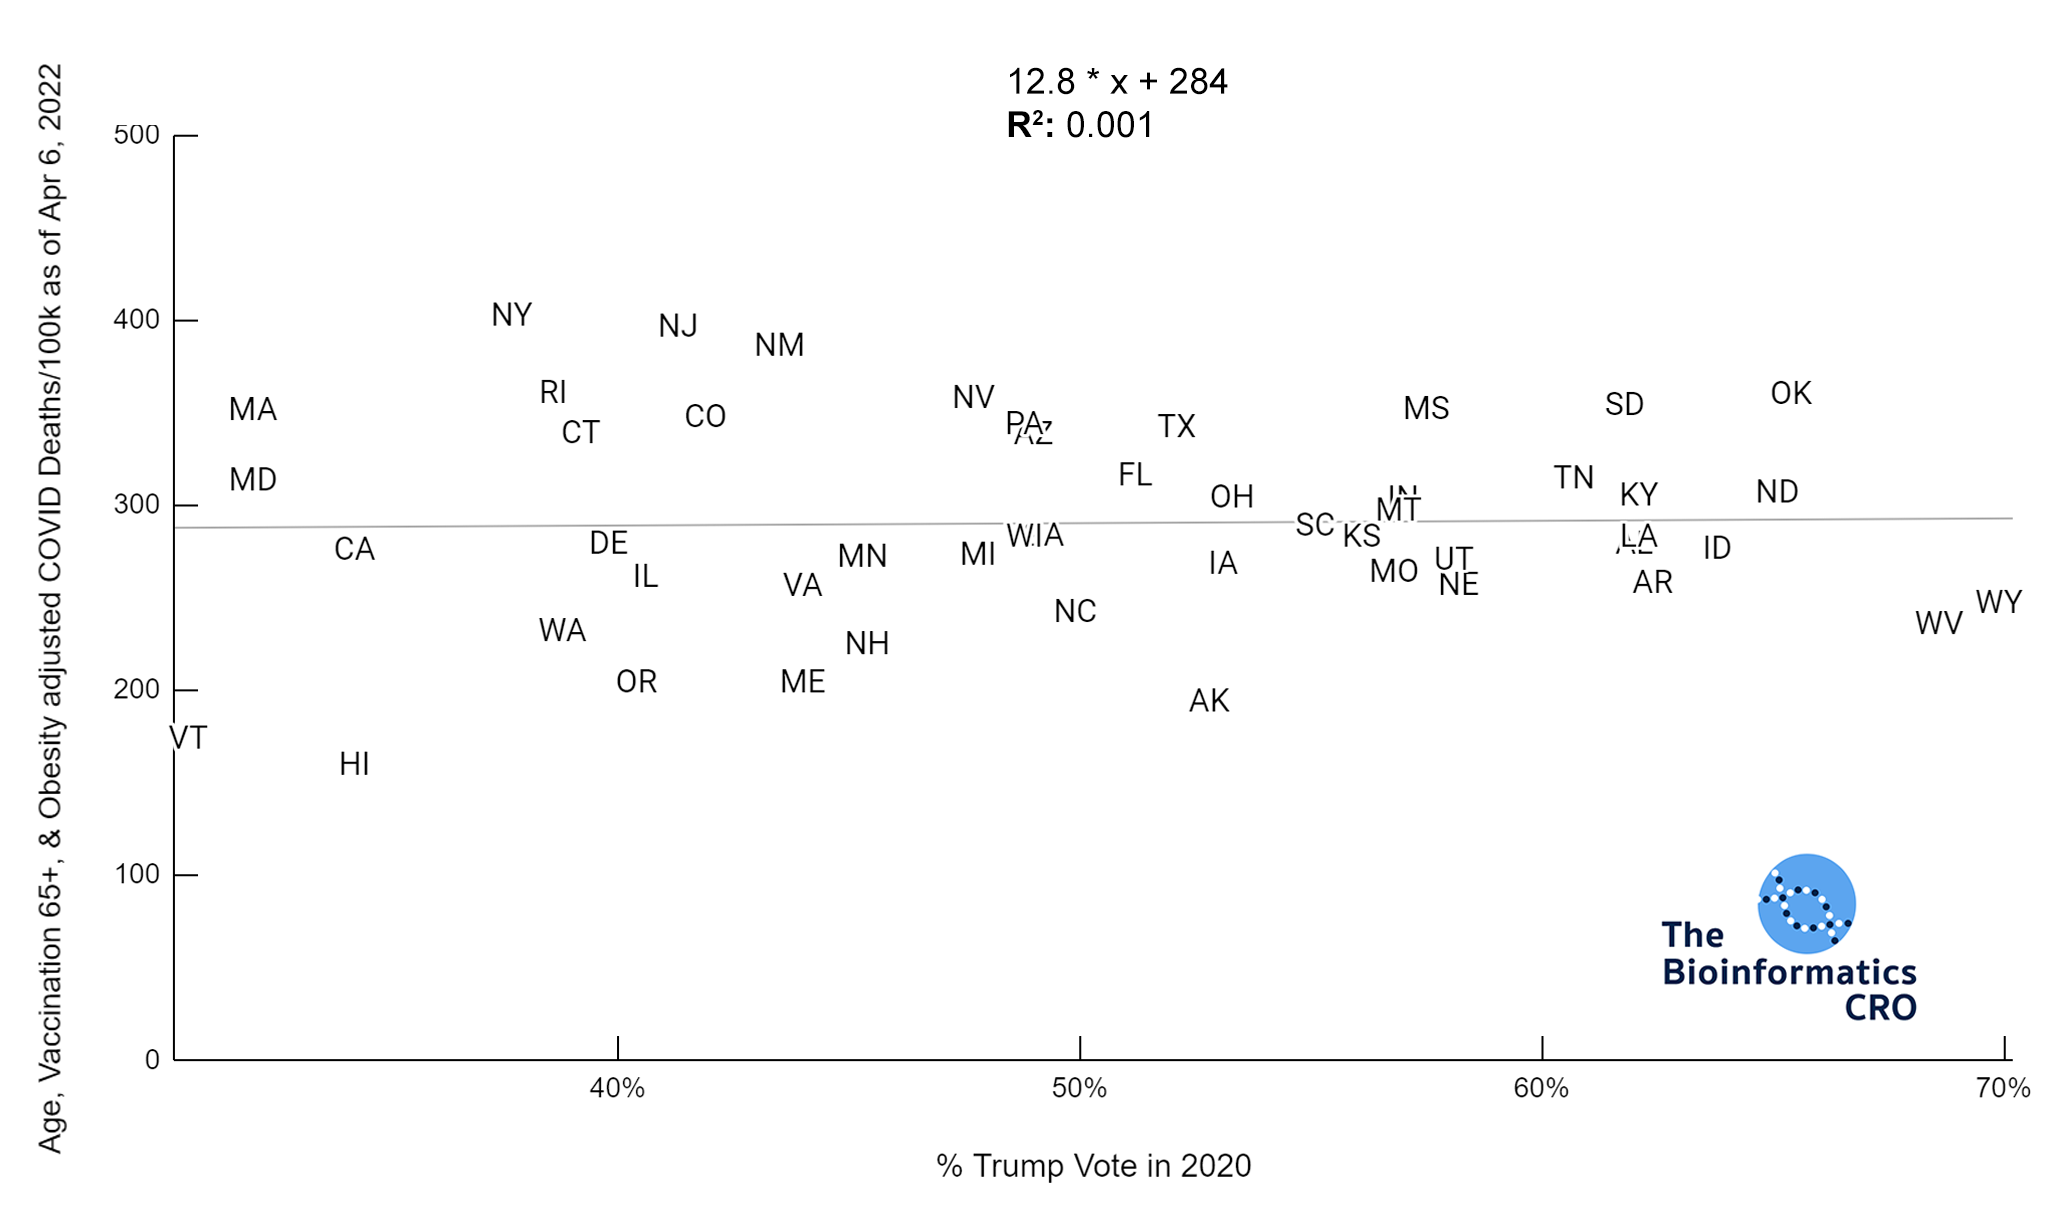
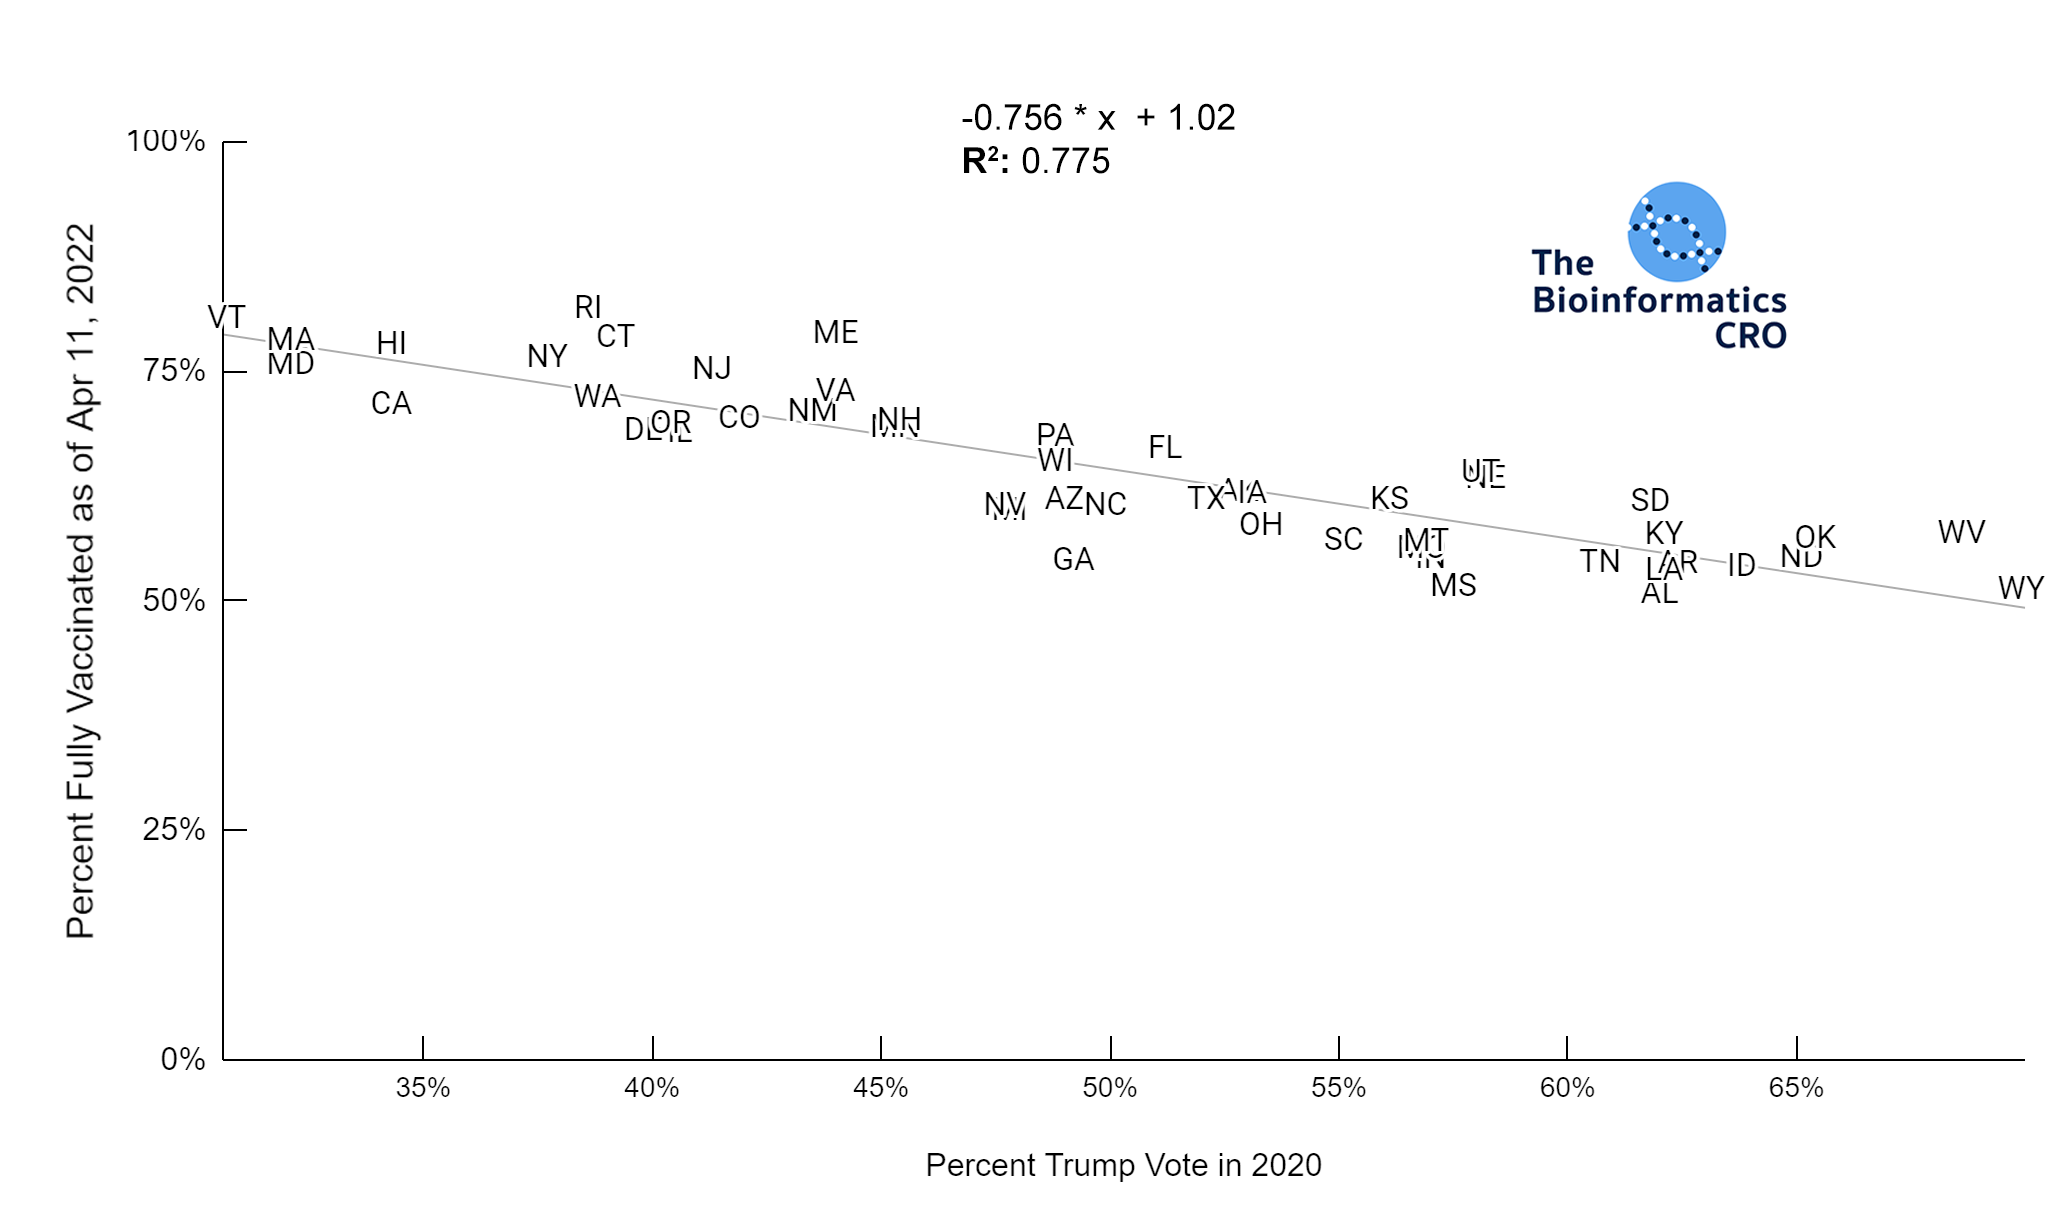
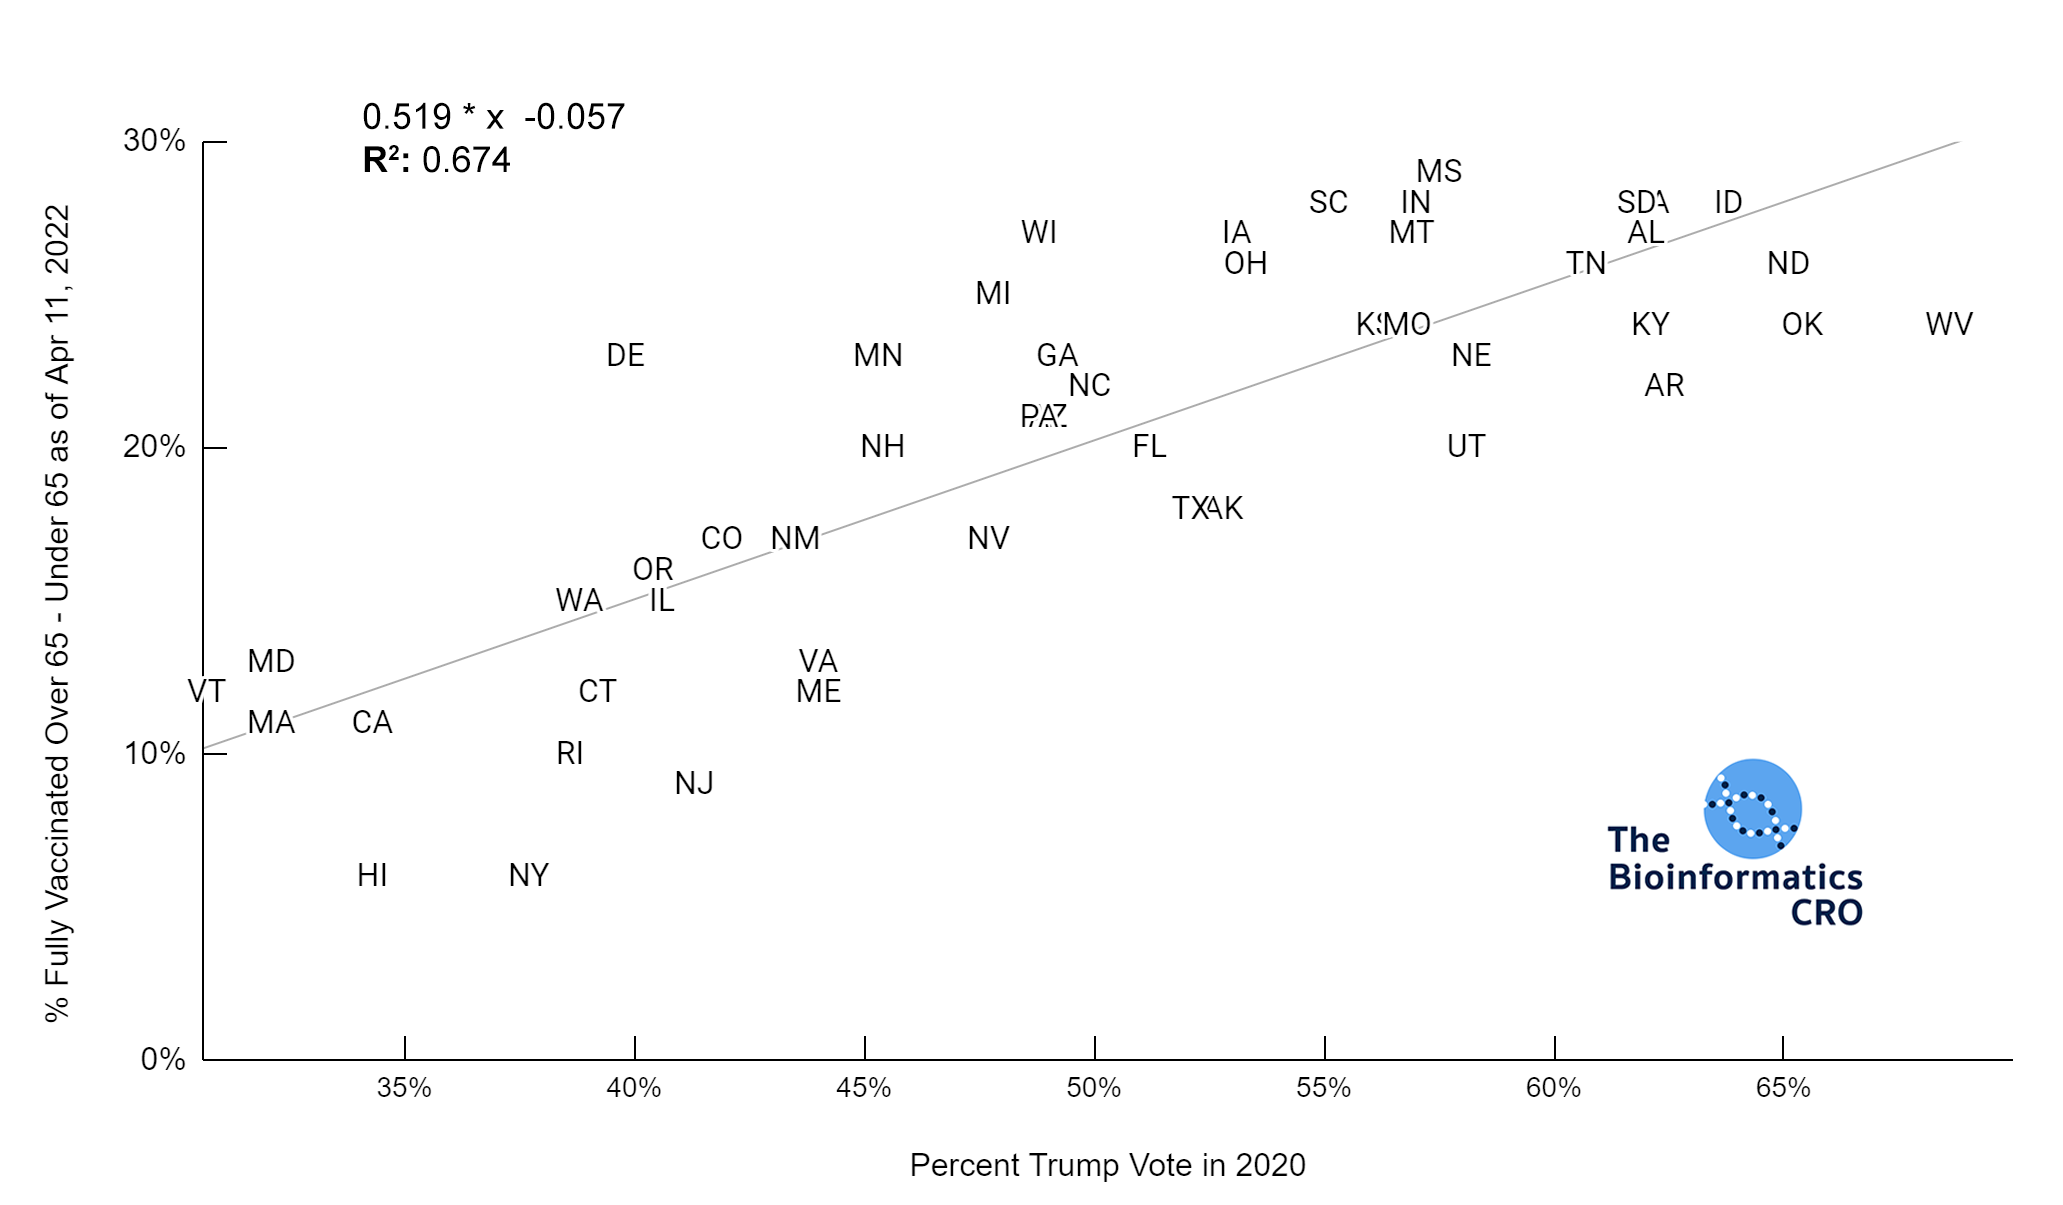
We used the percent of the population who voted for Trump in the 2020 presidential election to examine associations with partisanship. Although this will not be directly causal of COVID deaths, there has been a partisan aspect to vaccination in the United States, which does influence risk of death from COVID infection. Our analysis shows a very strong negative correlation between vaccination status and percent Trump vote. Additionally, although there was a strong correlation between obesity and Trump vote, in a multivariate linear model with obesity, and vaccination over 65, percent Trump vote was not significantly associated with age-adjusted COVID deaths (P=0.76).
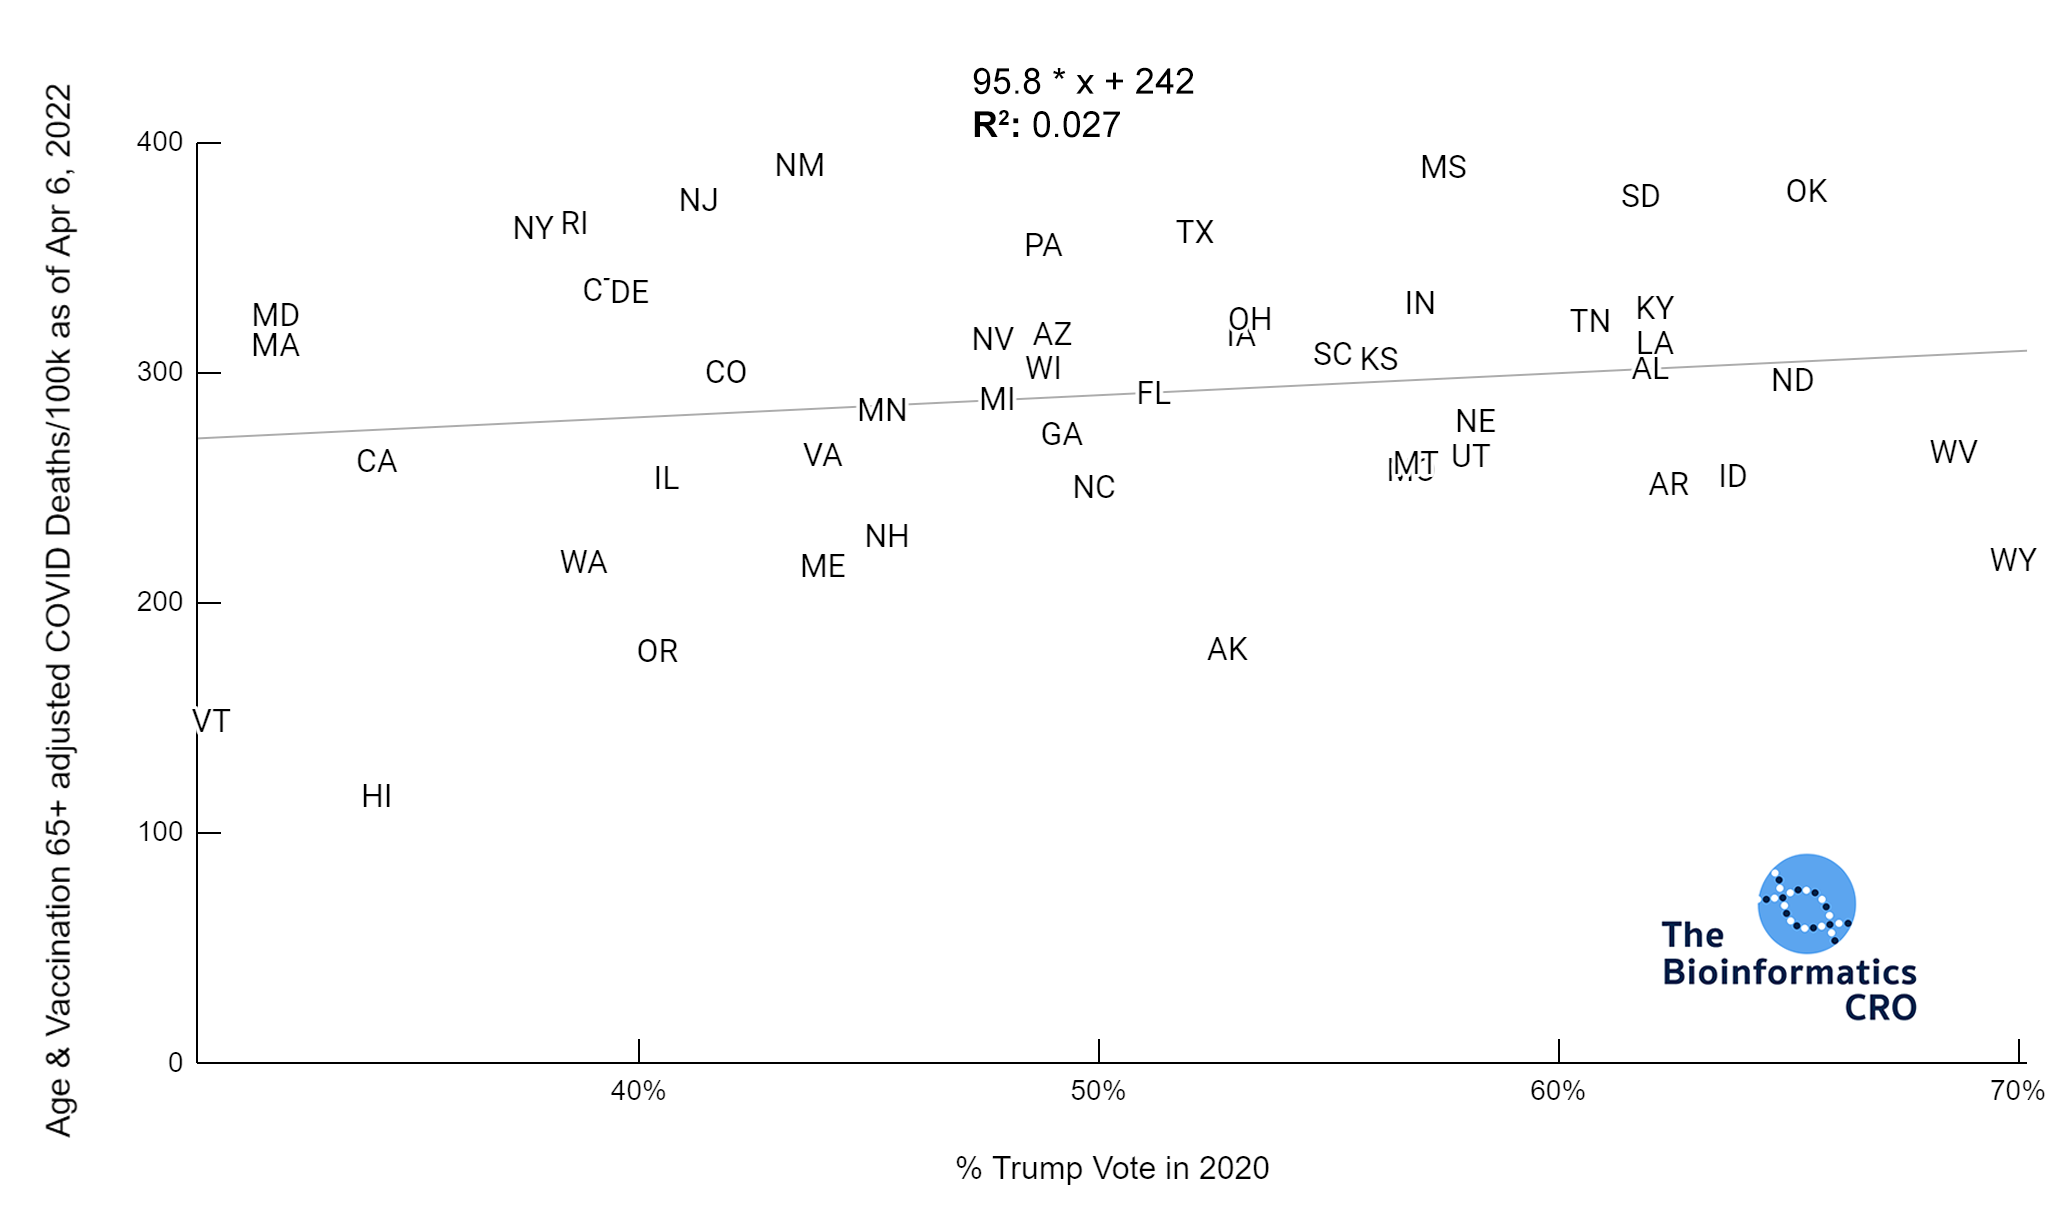
% Trump Vote (2020) and Vaccination Rate
% Trump Vote and Vaccination Rate 65+
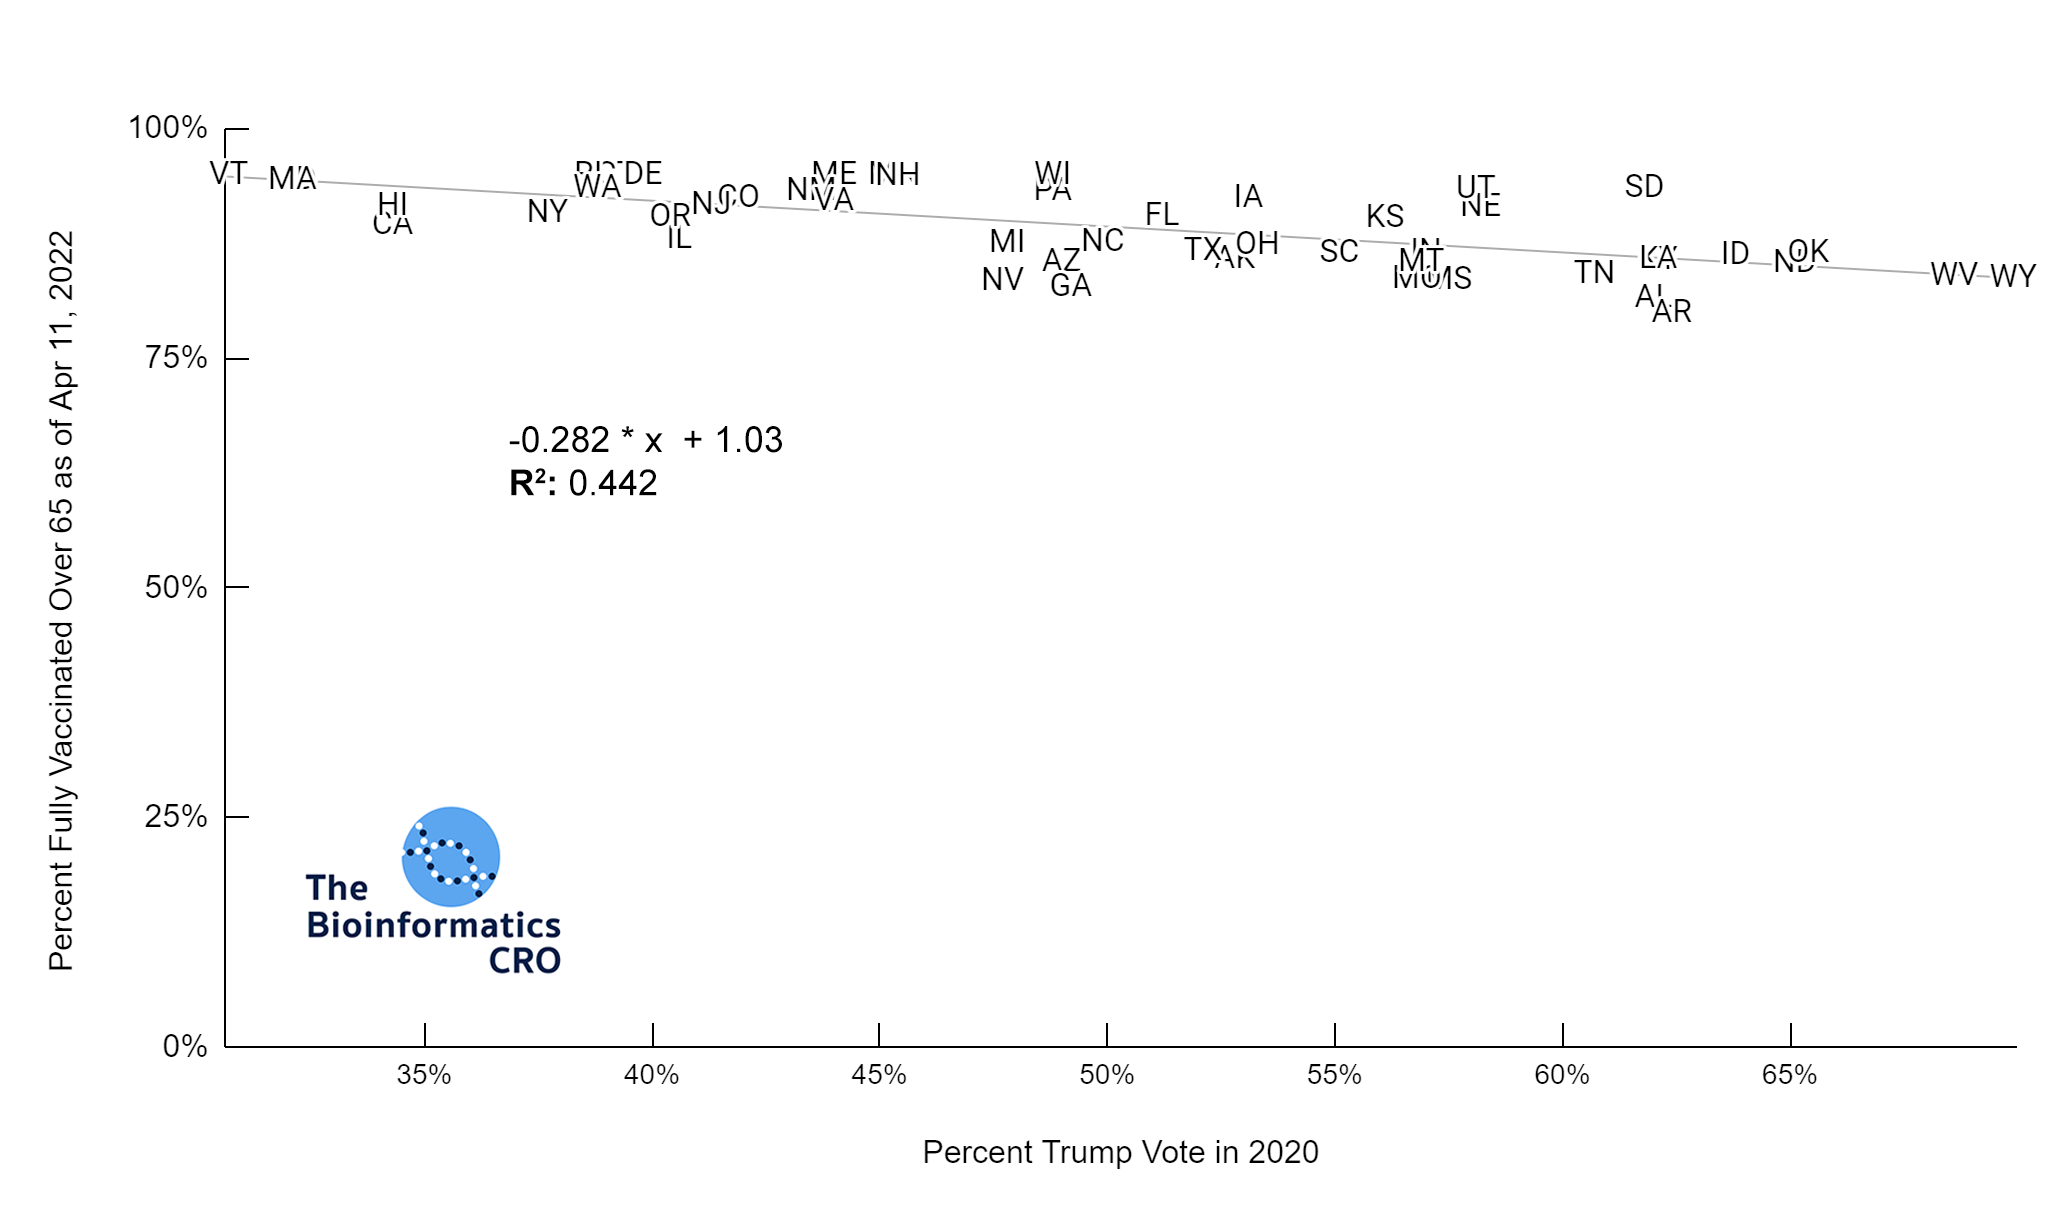
Most states showed high vaccination rates in people aged 65 and older, and significantly reduced vaccination rates in younger populations. Although states with high Trump vote had significantly lower vaccination rates in the 65+ age group (P<0.01), the difference was exaggerated in younger populations (P<0.01). This is also shown in the chart below (P<0.01).
Difference Between % Fully Vaccinated Over 65 & Under 65 and Trump Vote
Stringency Index and Age Adjusted COVID Deaths (Colored by Governor Partisanship)
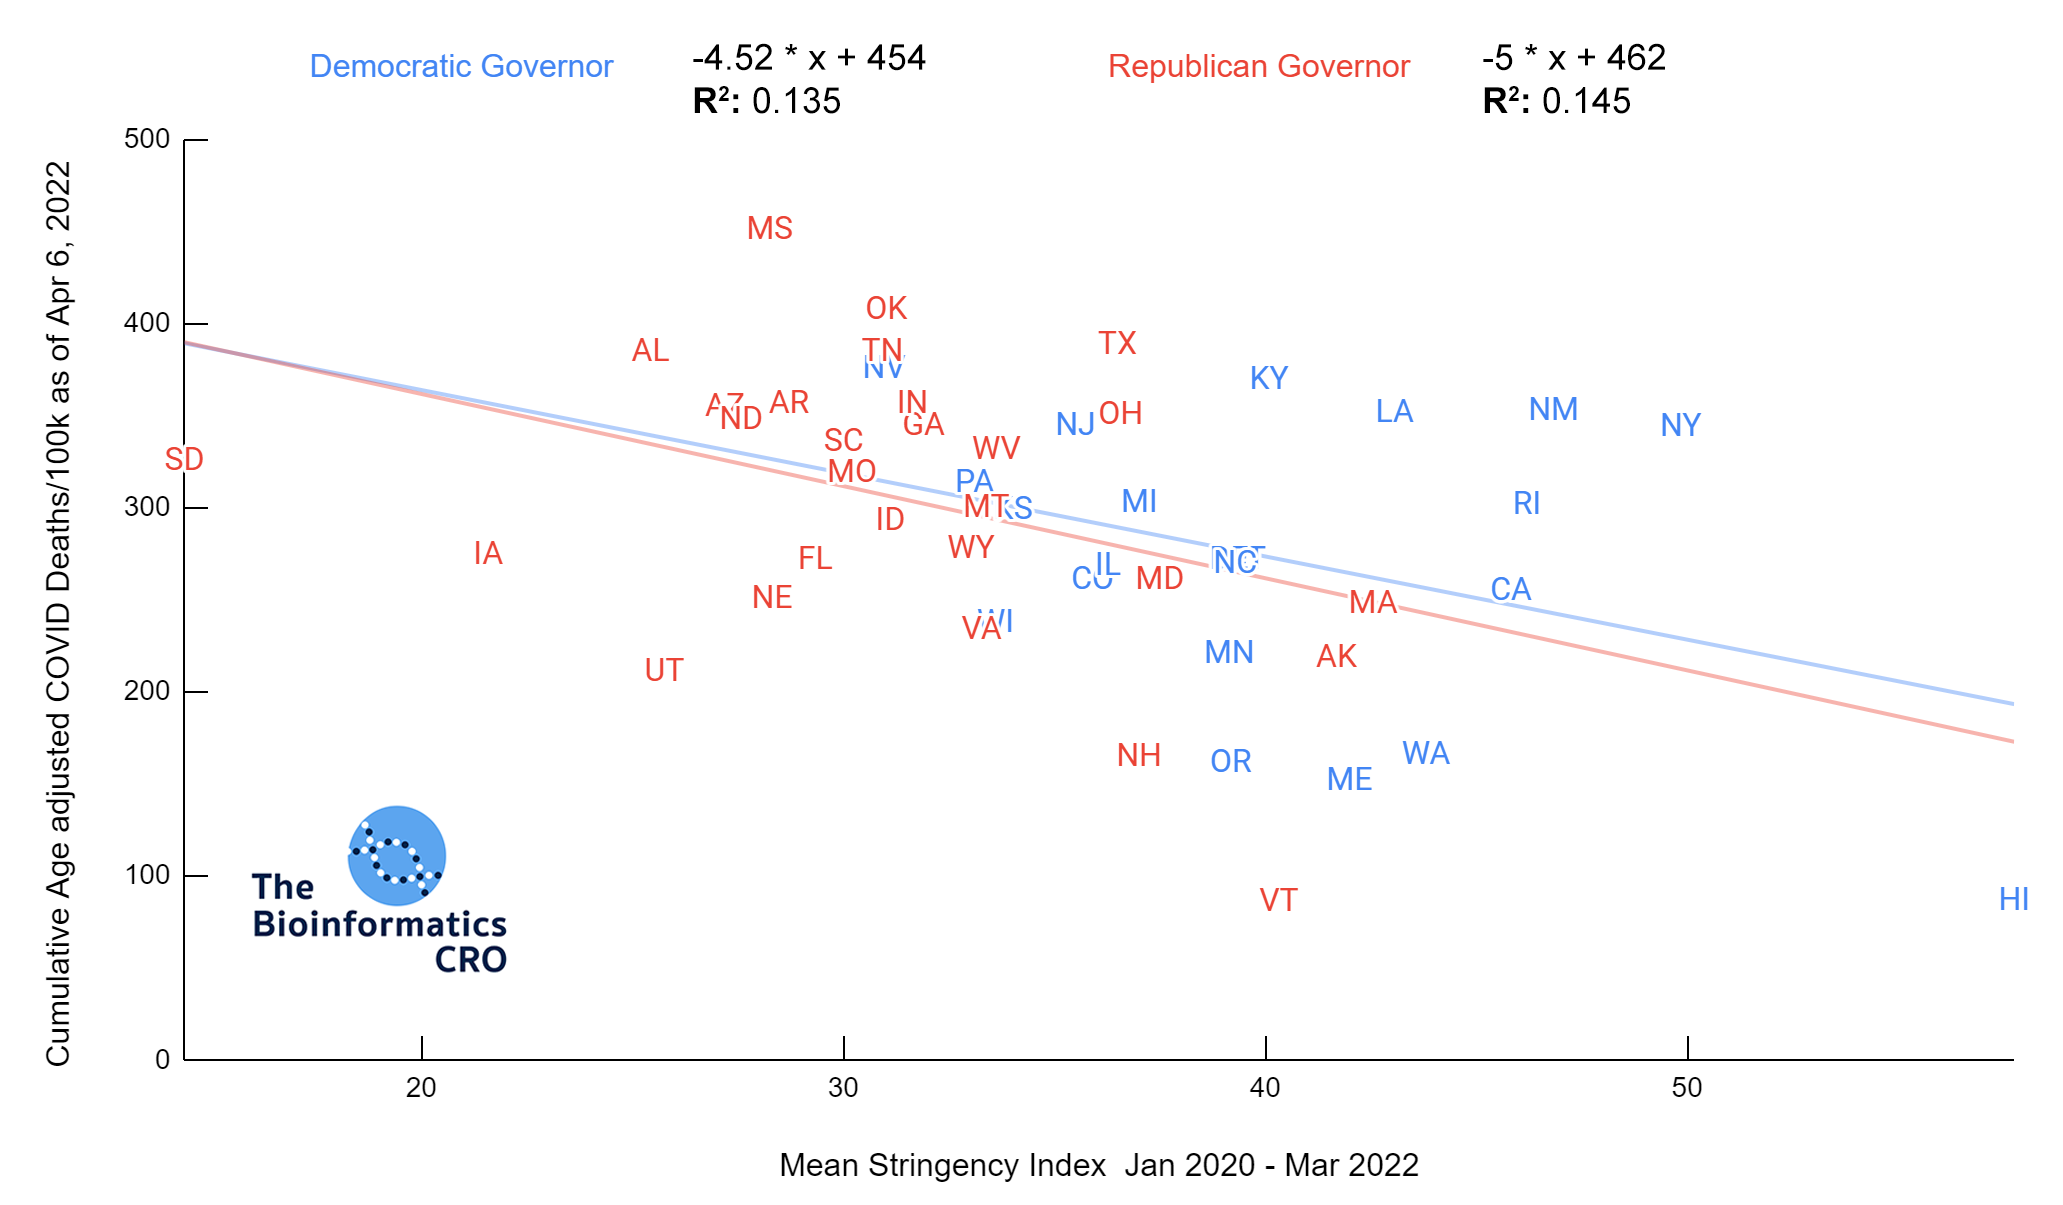
Summary Statistics for States with Democrat Governorss
Mean Age-adjusted COVID Deaths/100K = 272±77 (std dev)
Mean Stringency Index = 40.4±6.3 (std dev)
Summary Statistics for States with Republican Governors
Mean Age-adjusted COVID Deaths/100K = 305±79 (std dev)
Mean Stringency Index = 31.4±6.0 (std dev)
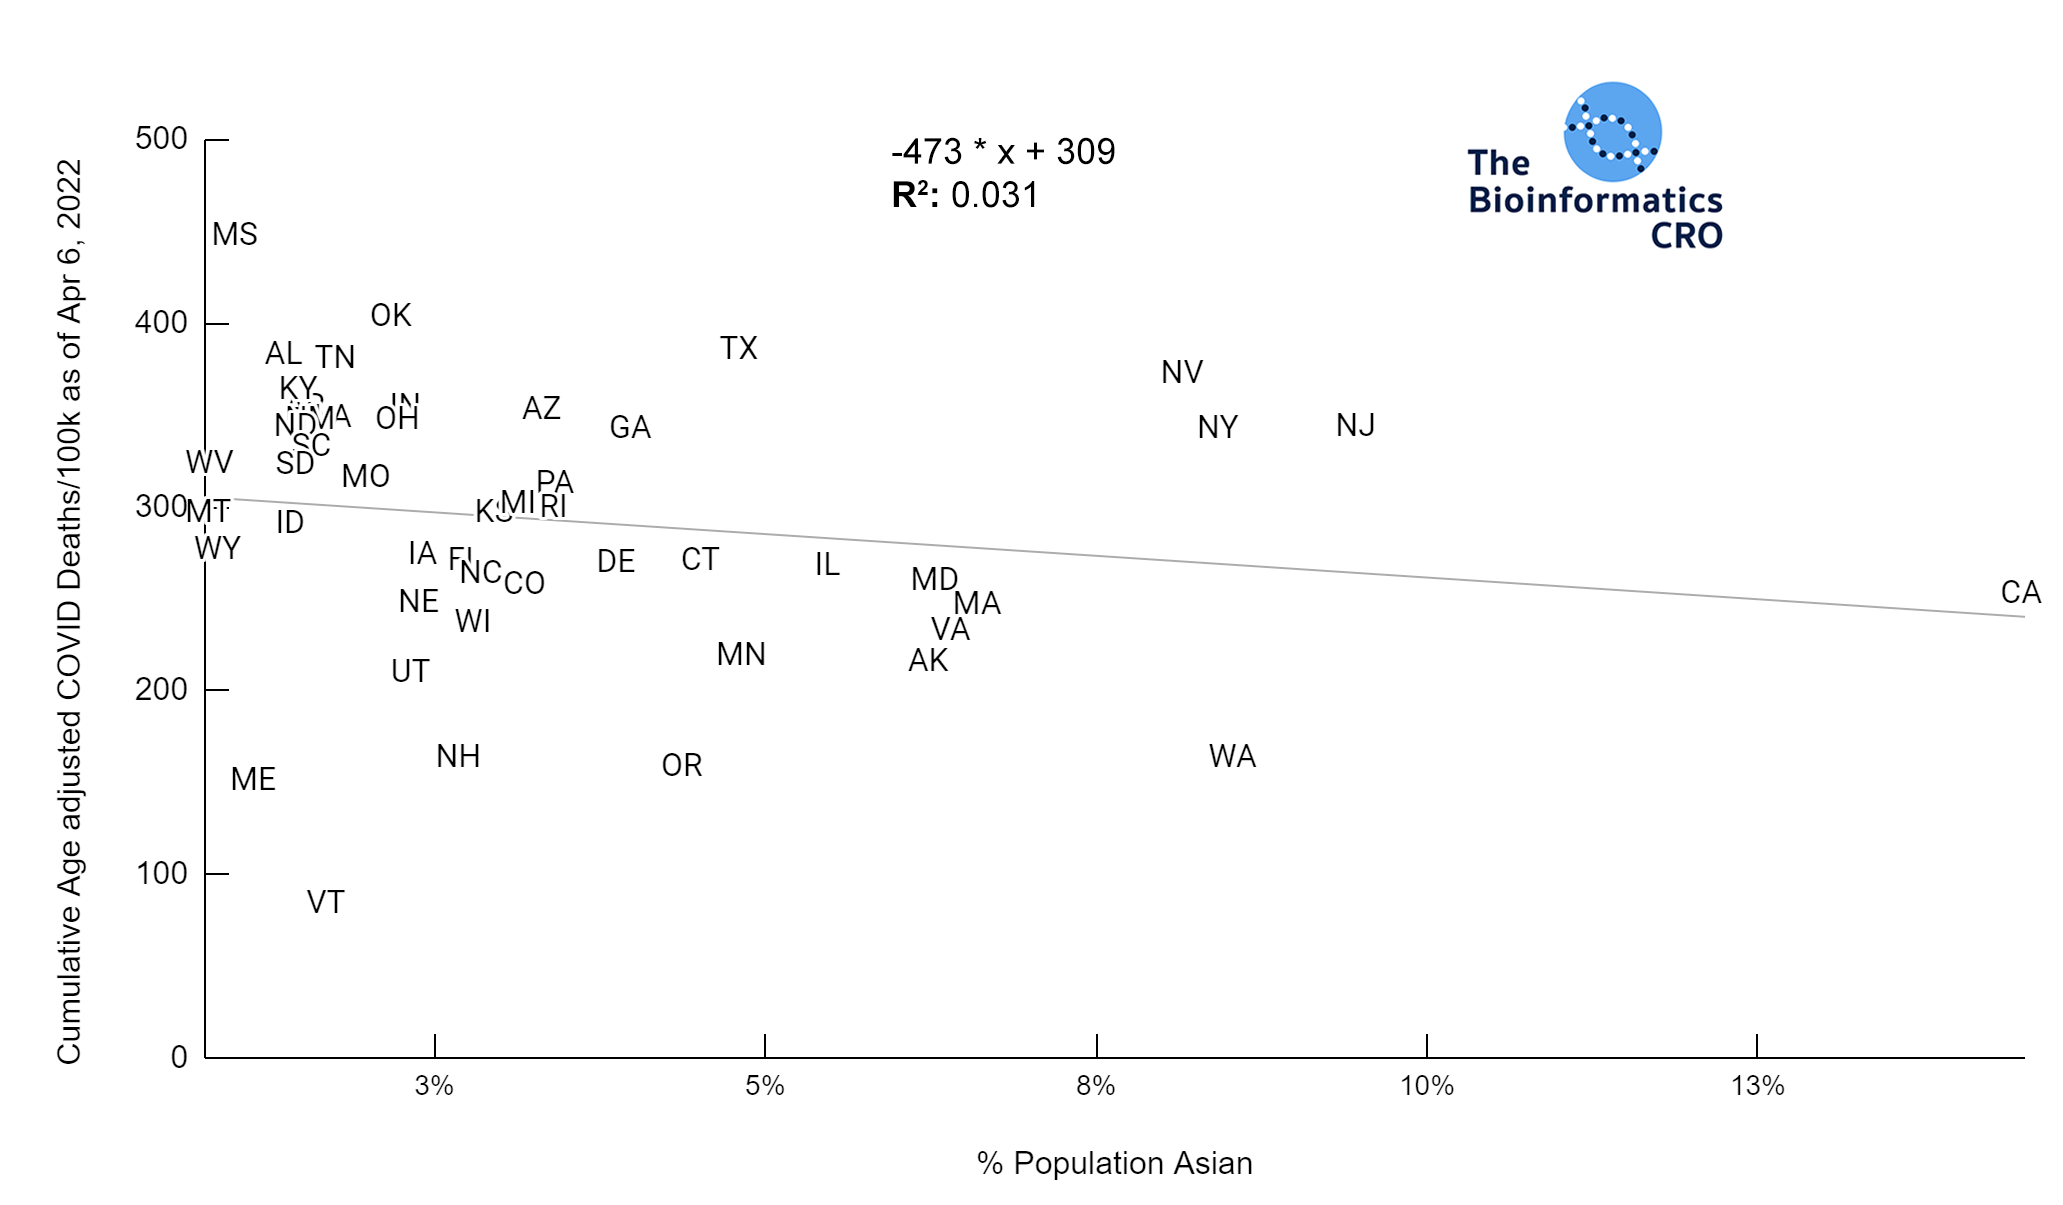
Race & Ethnicity
Members of some racial and ethnic minority groups are more likely to experience severe outcomes from COVID-19 infections. The prevalence of underlying comorbidities that increase risk of severe outcomes from COVID infection (i.e. cardiovascular disease, asthma, obesity) vary by race and ethnicity and they may face differences in access to adequate healthcare resources. As the racial composition of Hawaii is significantly different from the rest of the United States (i.e. an outlier), it was excluded from this analysis.
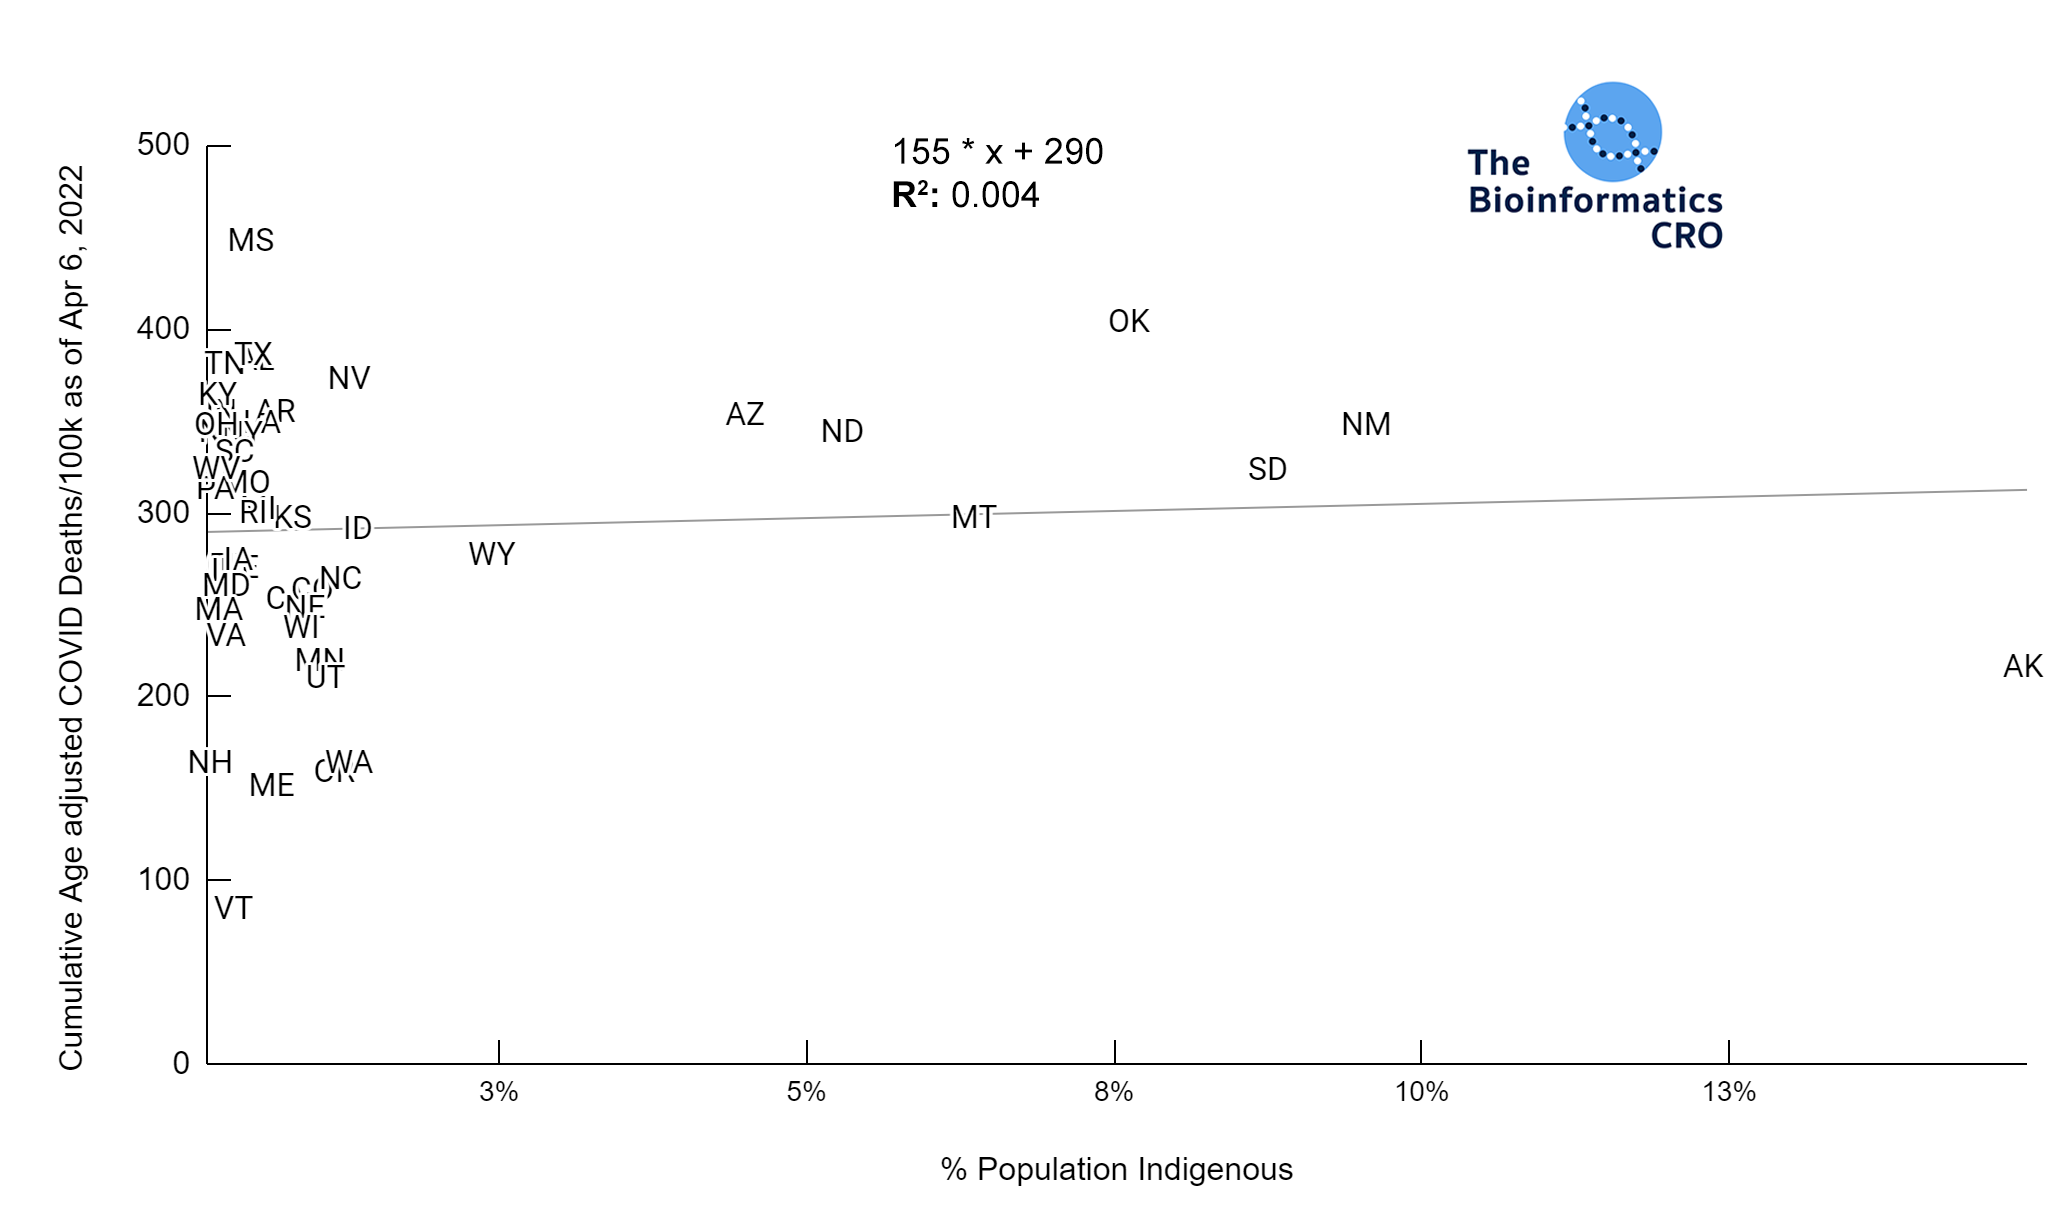
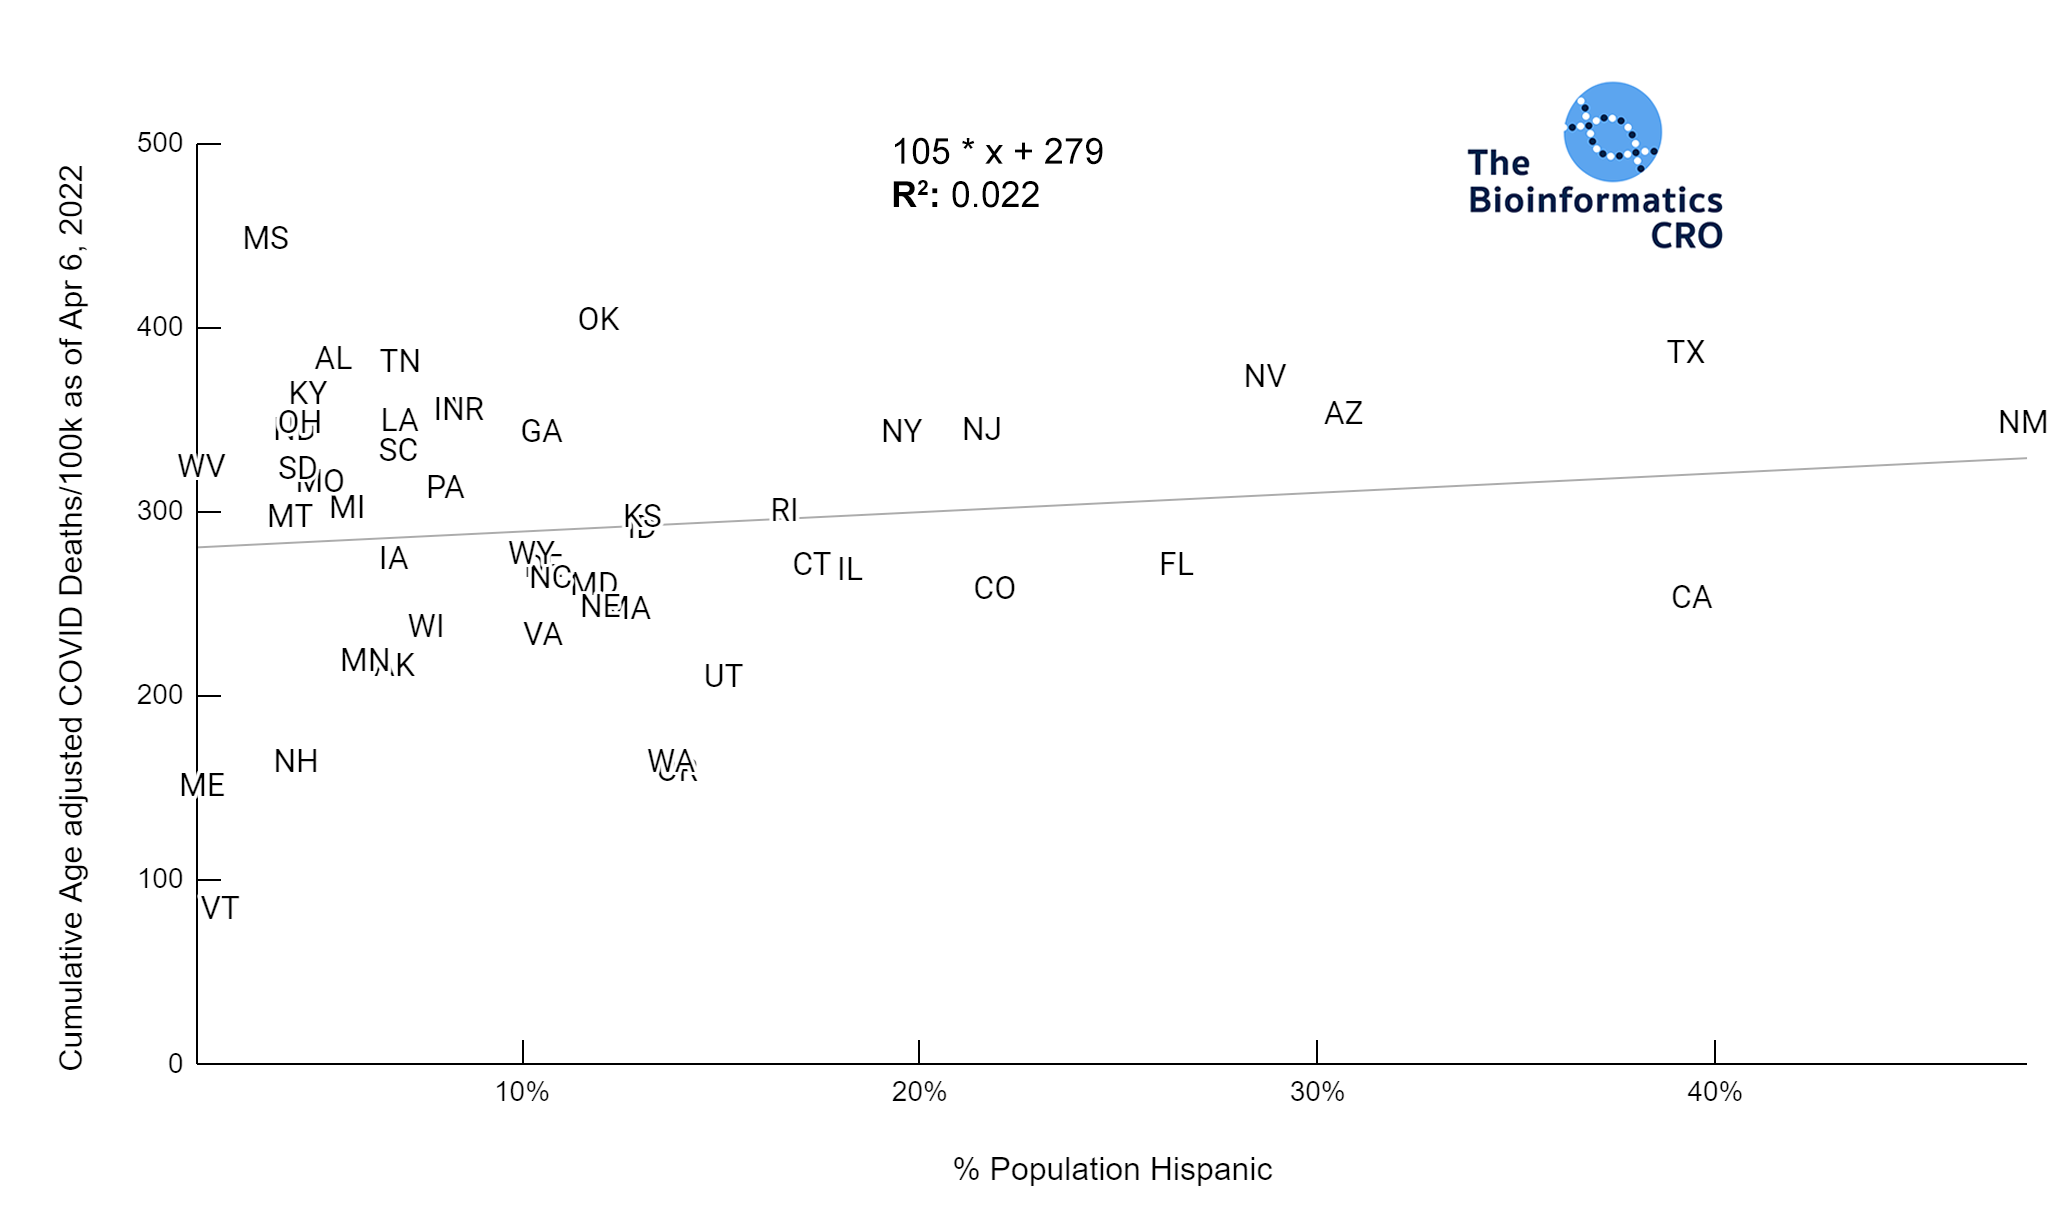
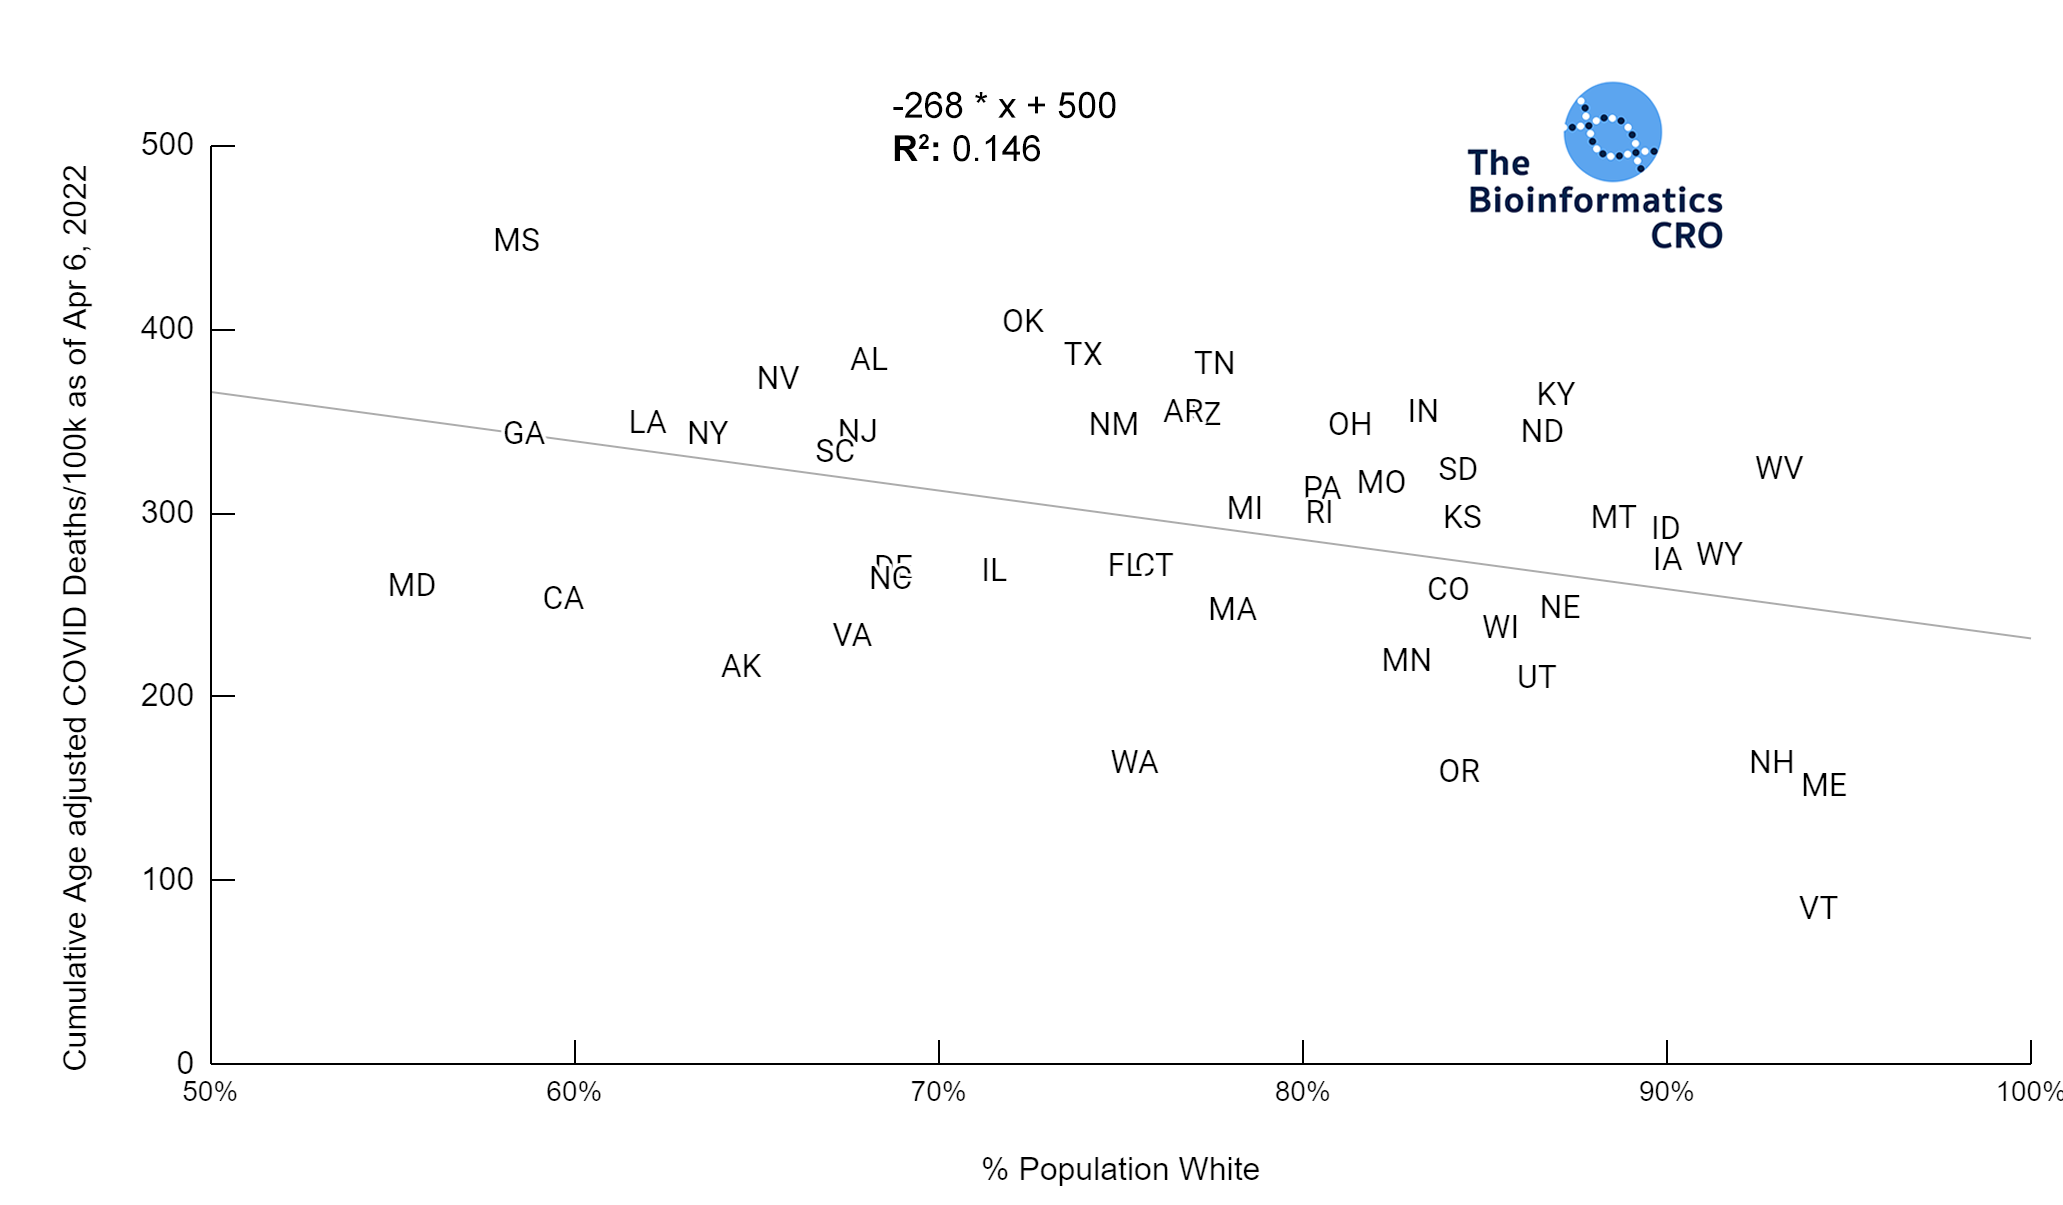 It should be noted that the race and ethnicity data are not normally distributed (Shapiro Test P<0.01 for all).
White P<0.01 | Black P<0.01 | Asian P=0.22 | Indigenous P=0.66 | Hispanic P=0.30
It should be noted that the race and ethnicity data are not normally distributed (Shapiro Test P<0.01 for all).
White P<0.01 | Black P<0.01 | Asian P=0.22 | Indigenous P=0.66 | Hispanic P=0.30 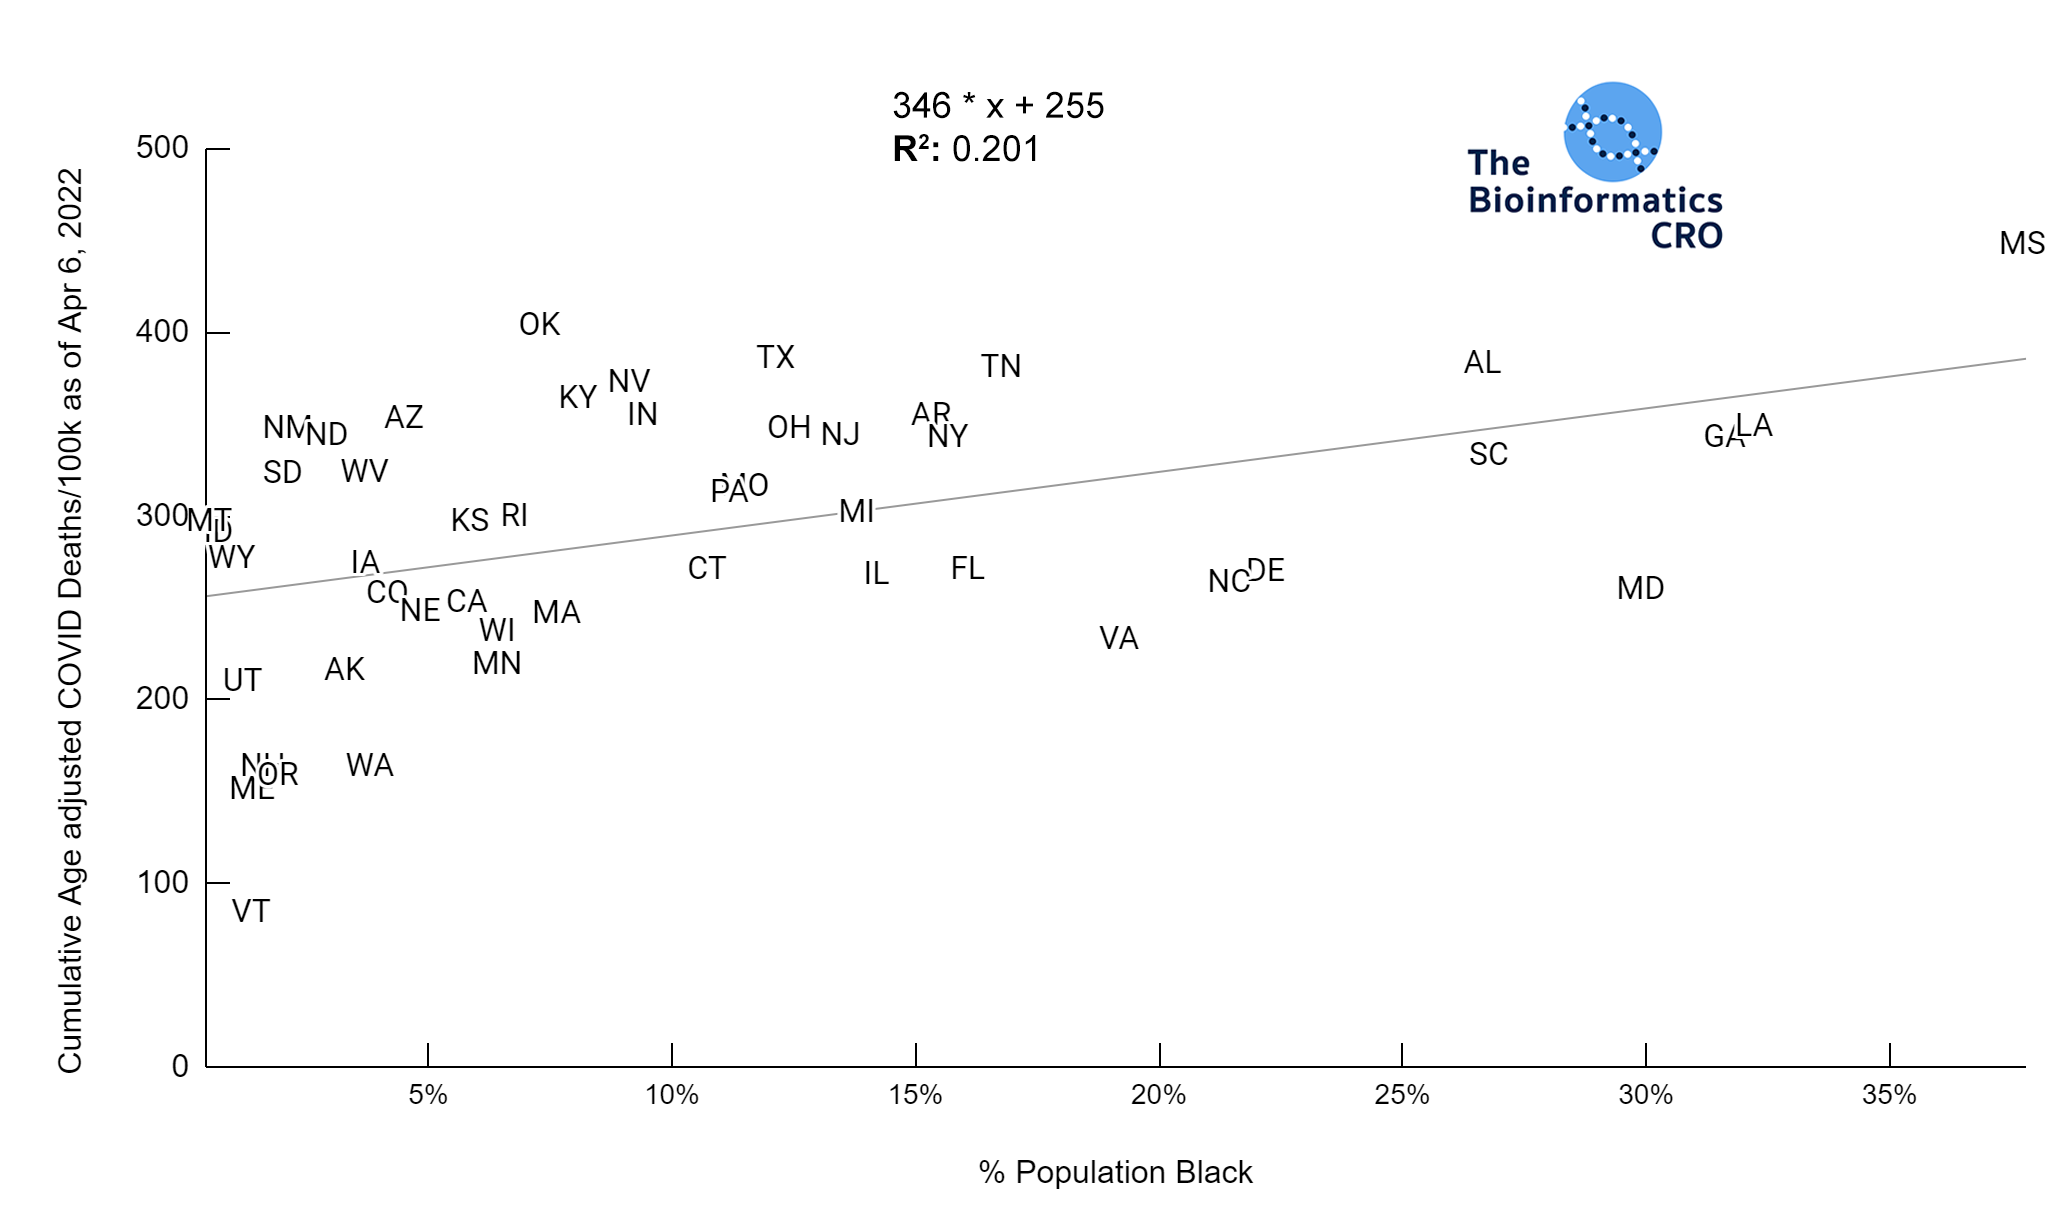
Race & Ethnicity and COVID Deaths Adjusted for Age, Vaccination Over 65 & Obesity
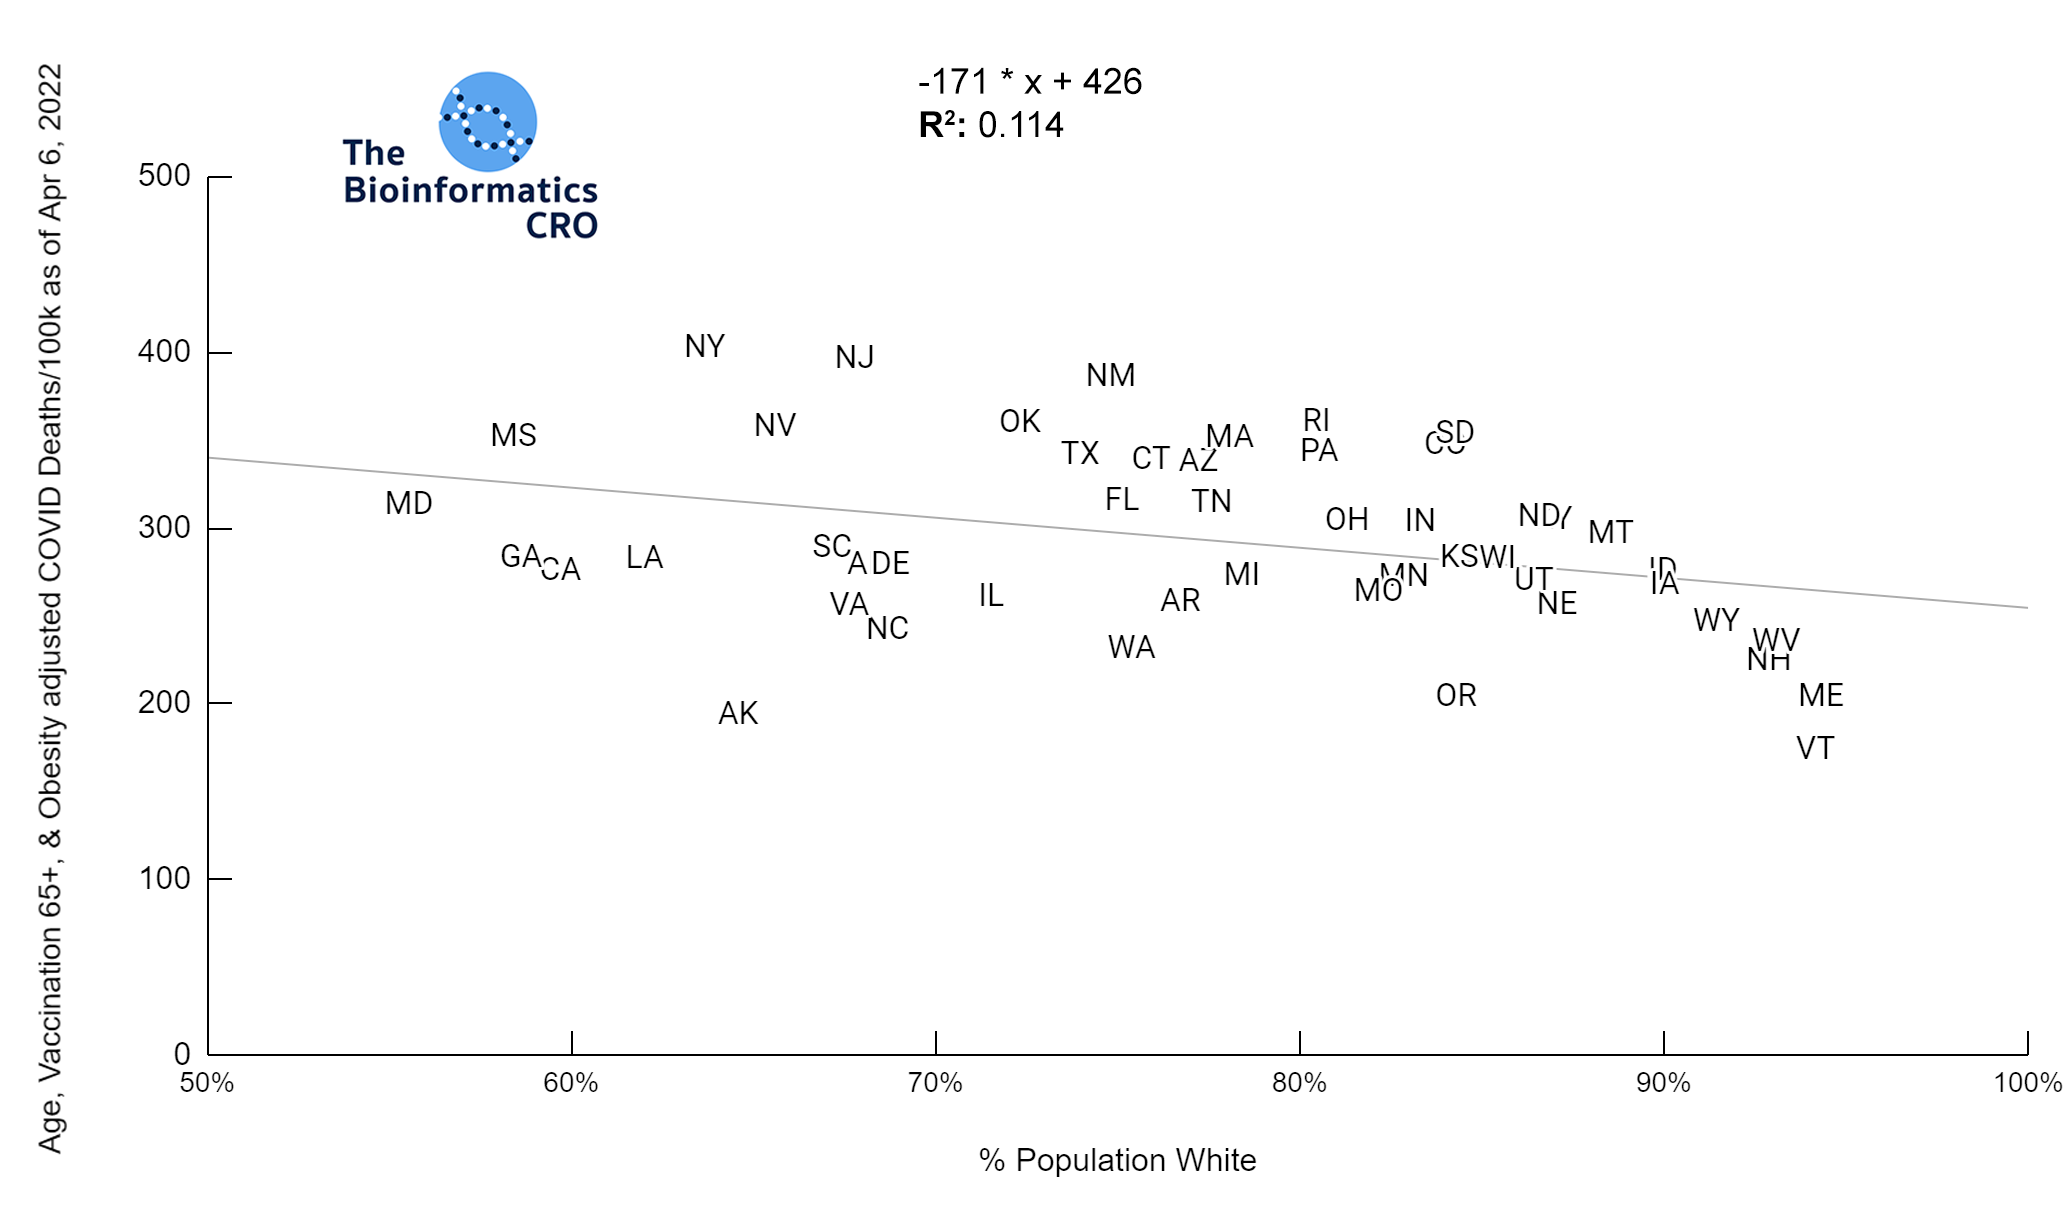 It should be noted that the race and ethnicity data are not normally distributed (Shapiro Test P<0.01 for all).
White P<0.05 | Black P=0.19 | Asian P=0.26 | Indigenous P=0.70 | Hispanic P<0.01
It should be noted that the race and ethnicity data are not normally distributed (Shapiro Test P<0.01 for all).
White P<0.05 | Black P=0.19 | Asian P=0.26 | Indigenous P=0.70 | Hispanic P<0.01 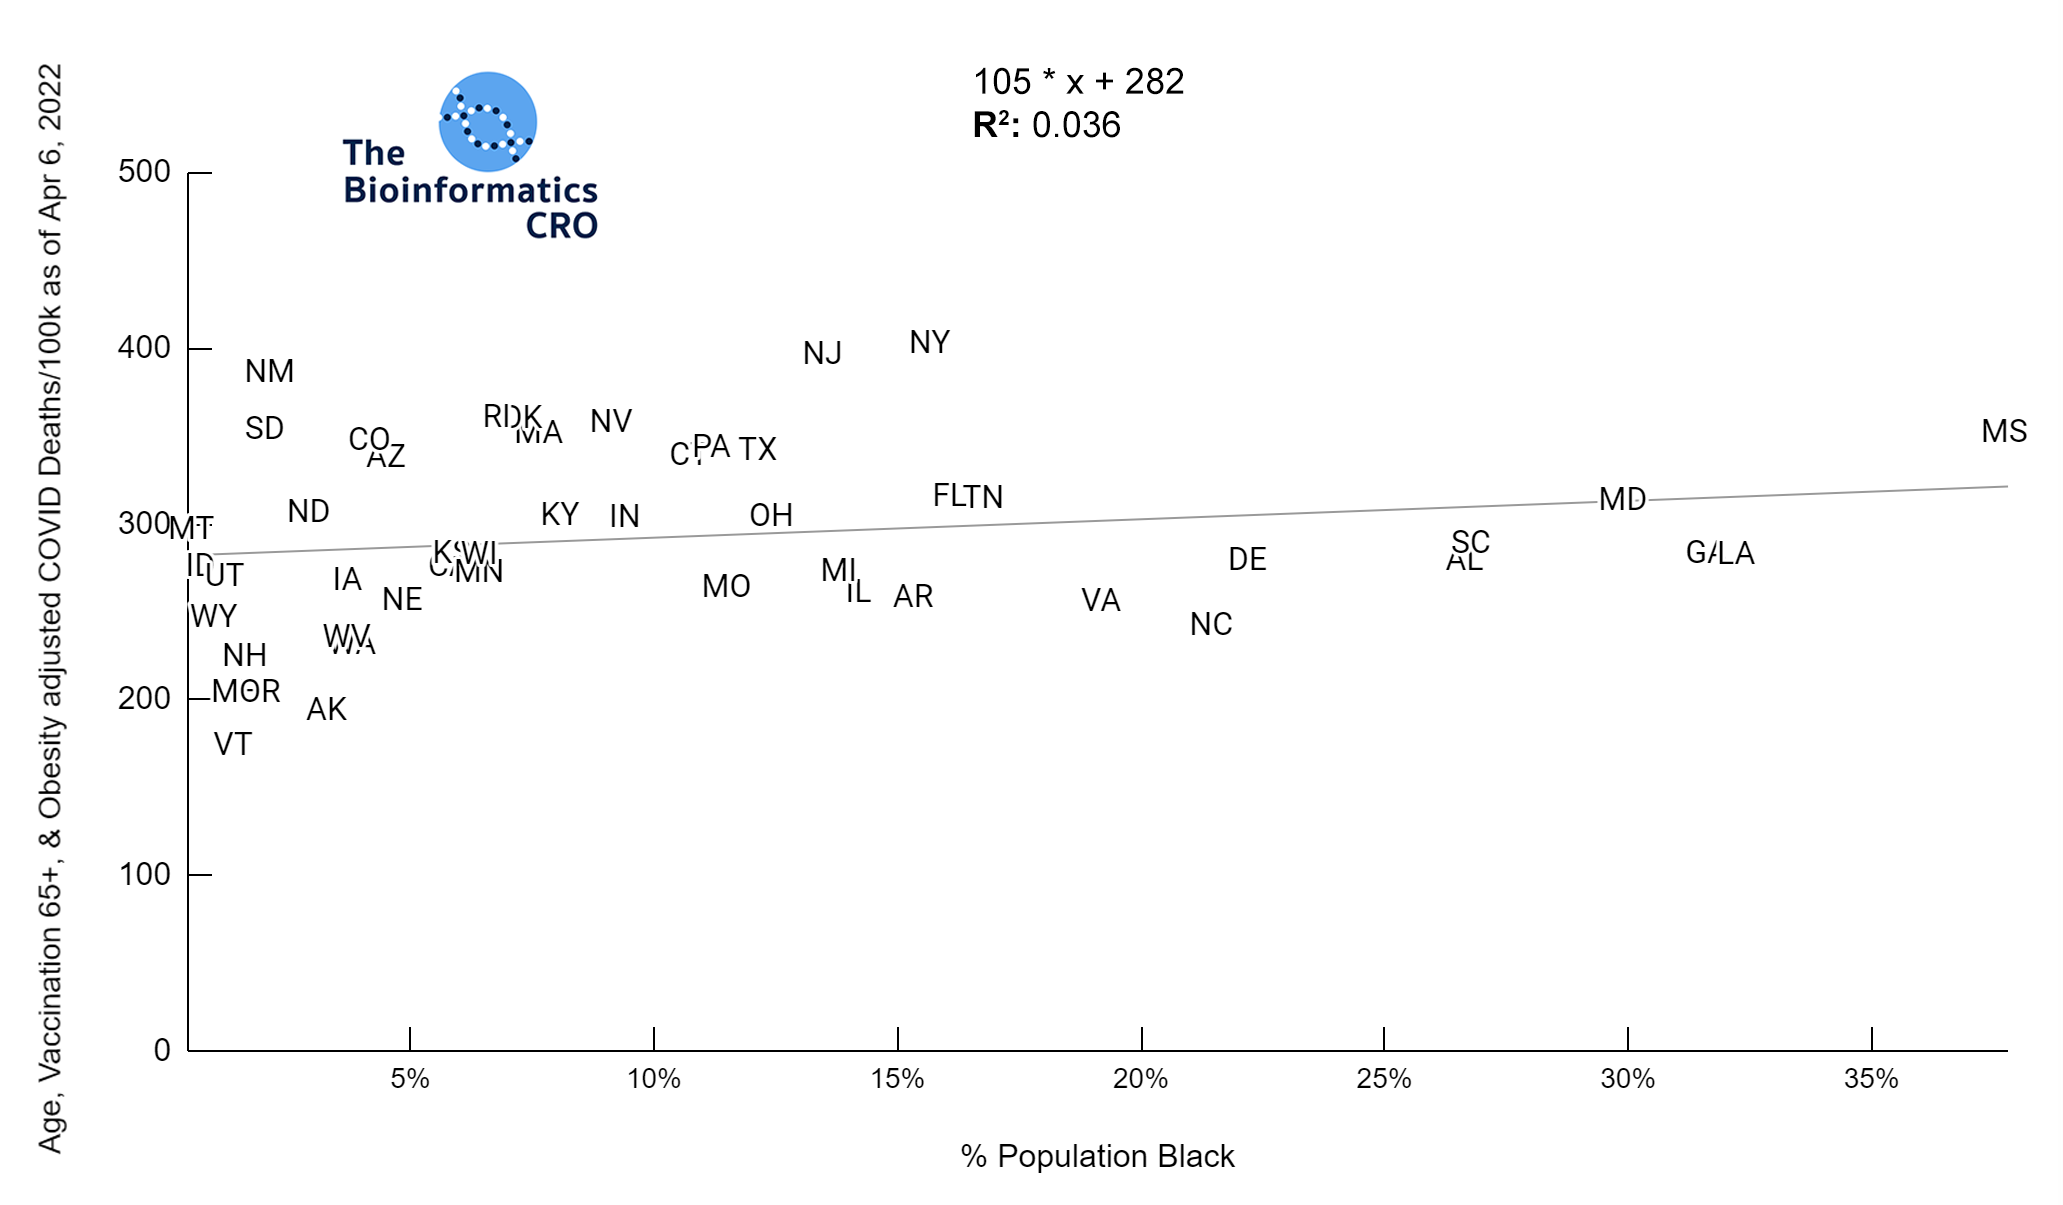
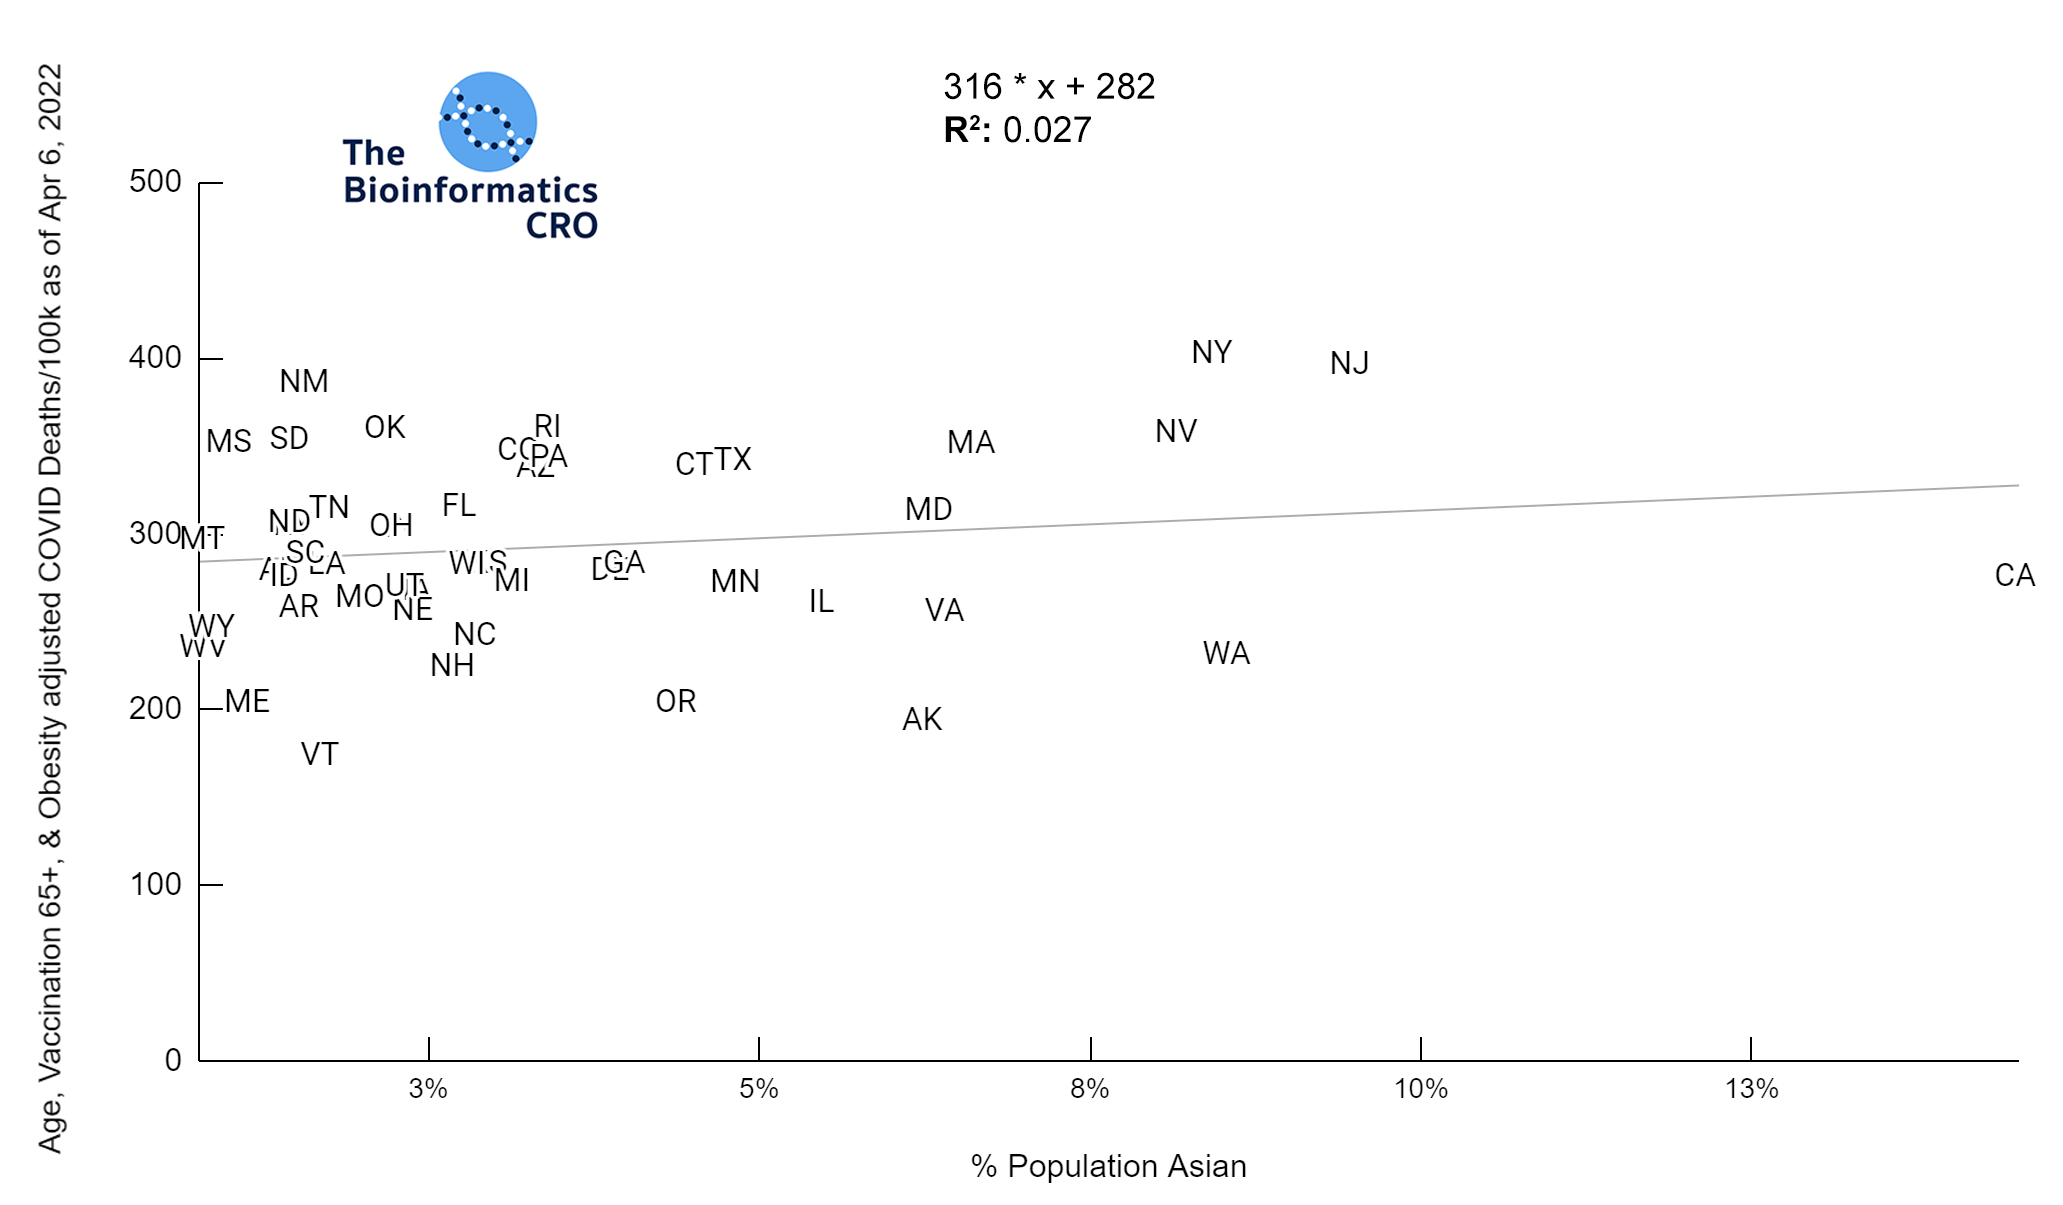
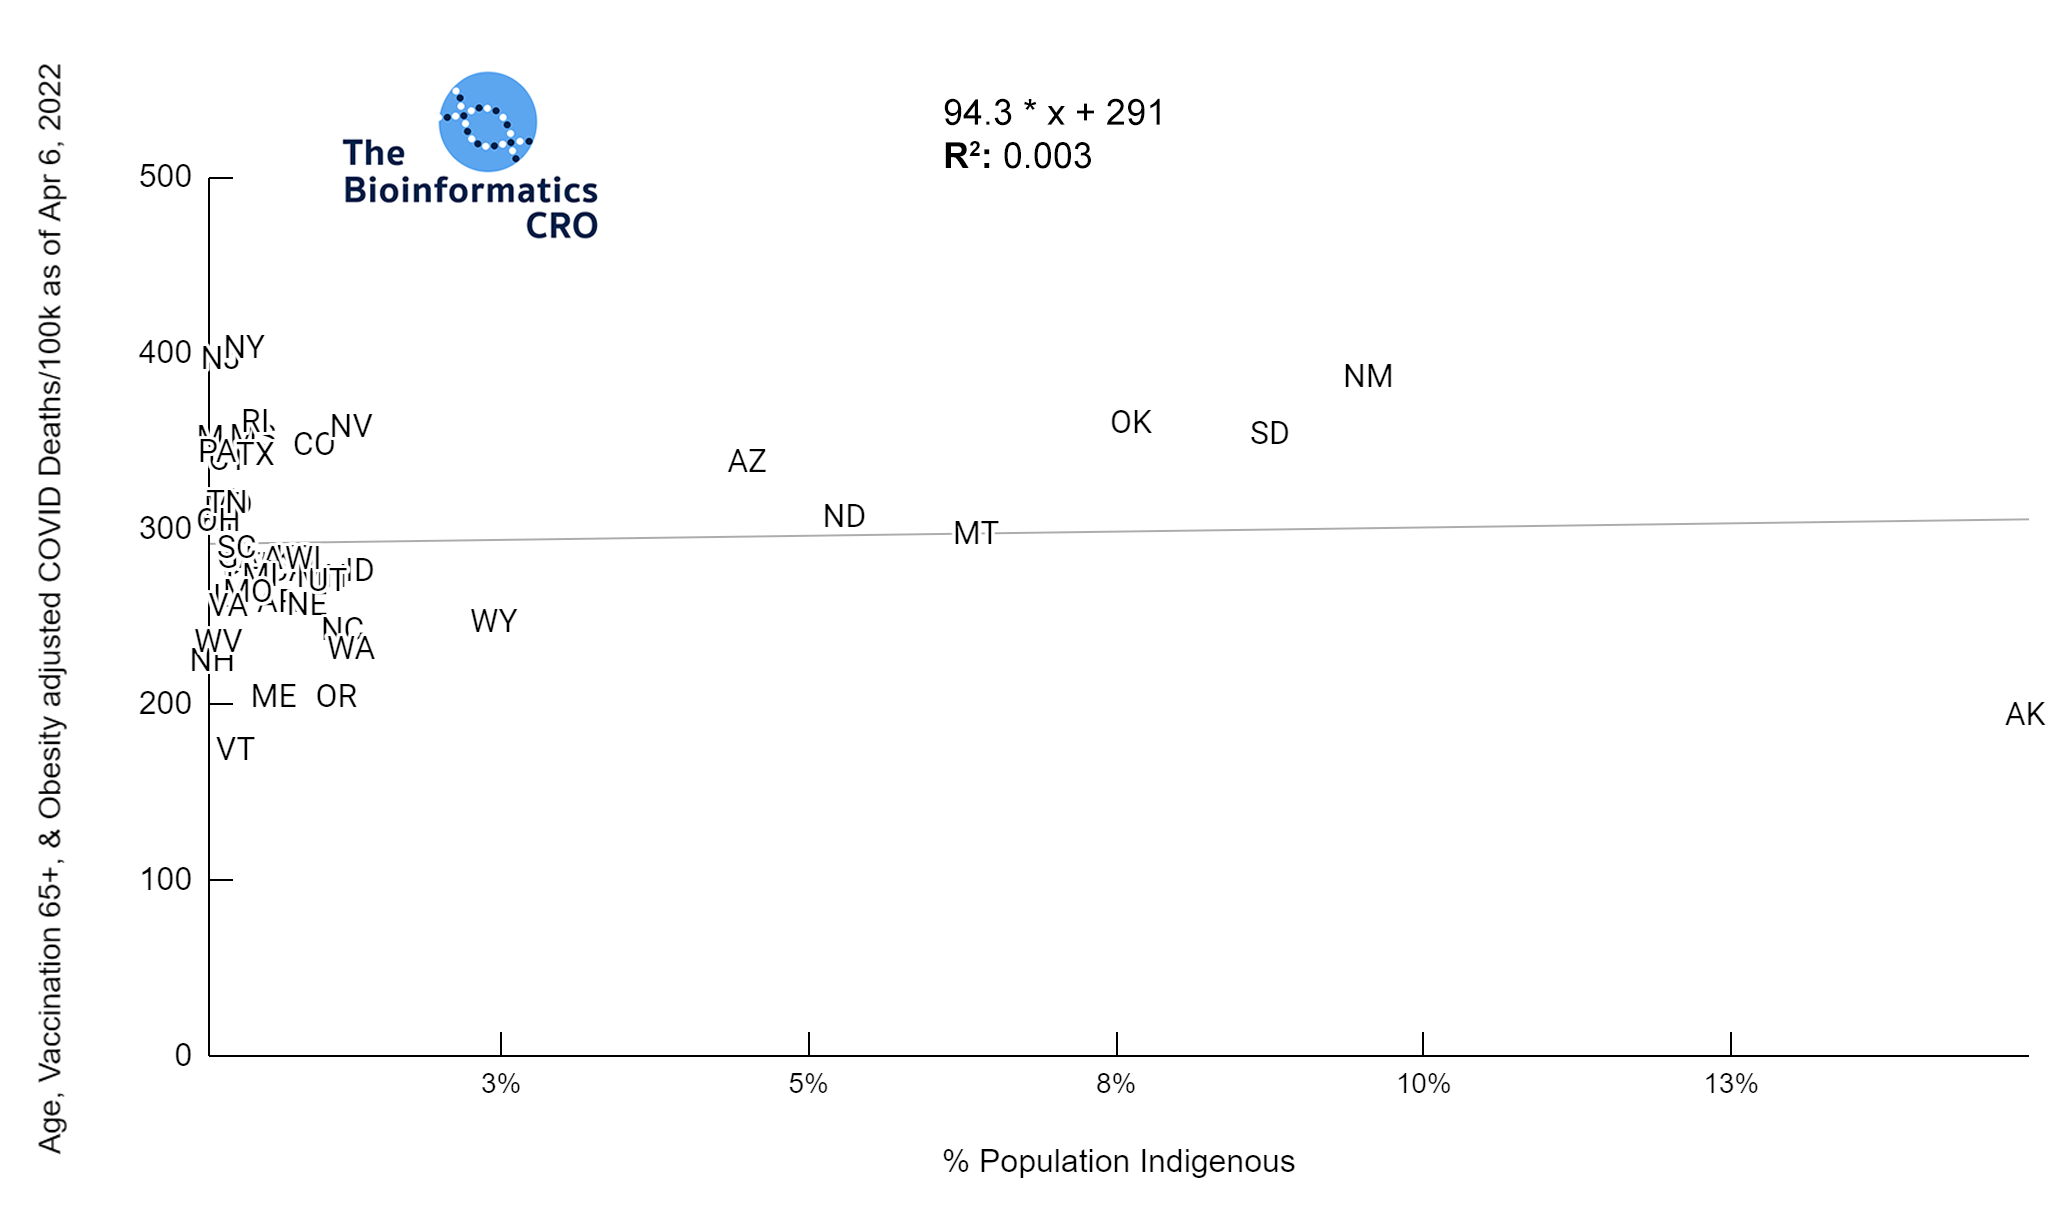
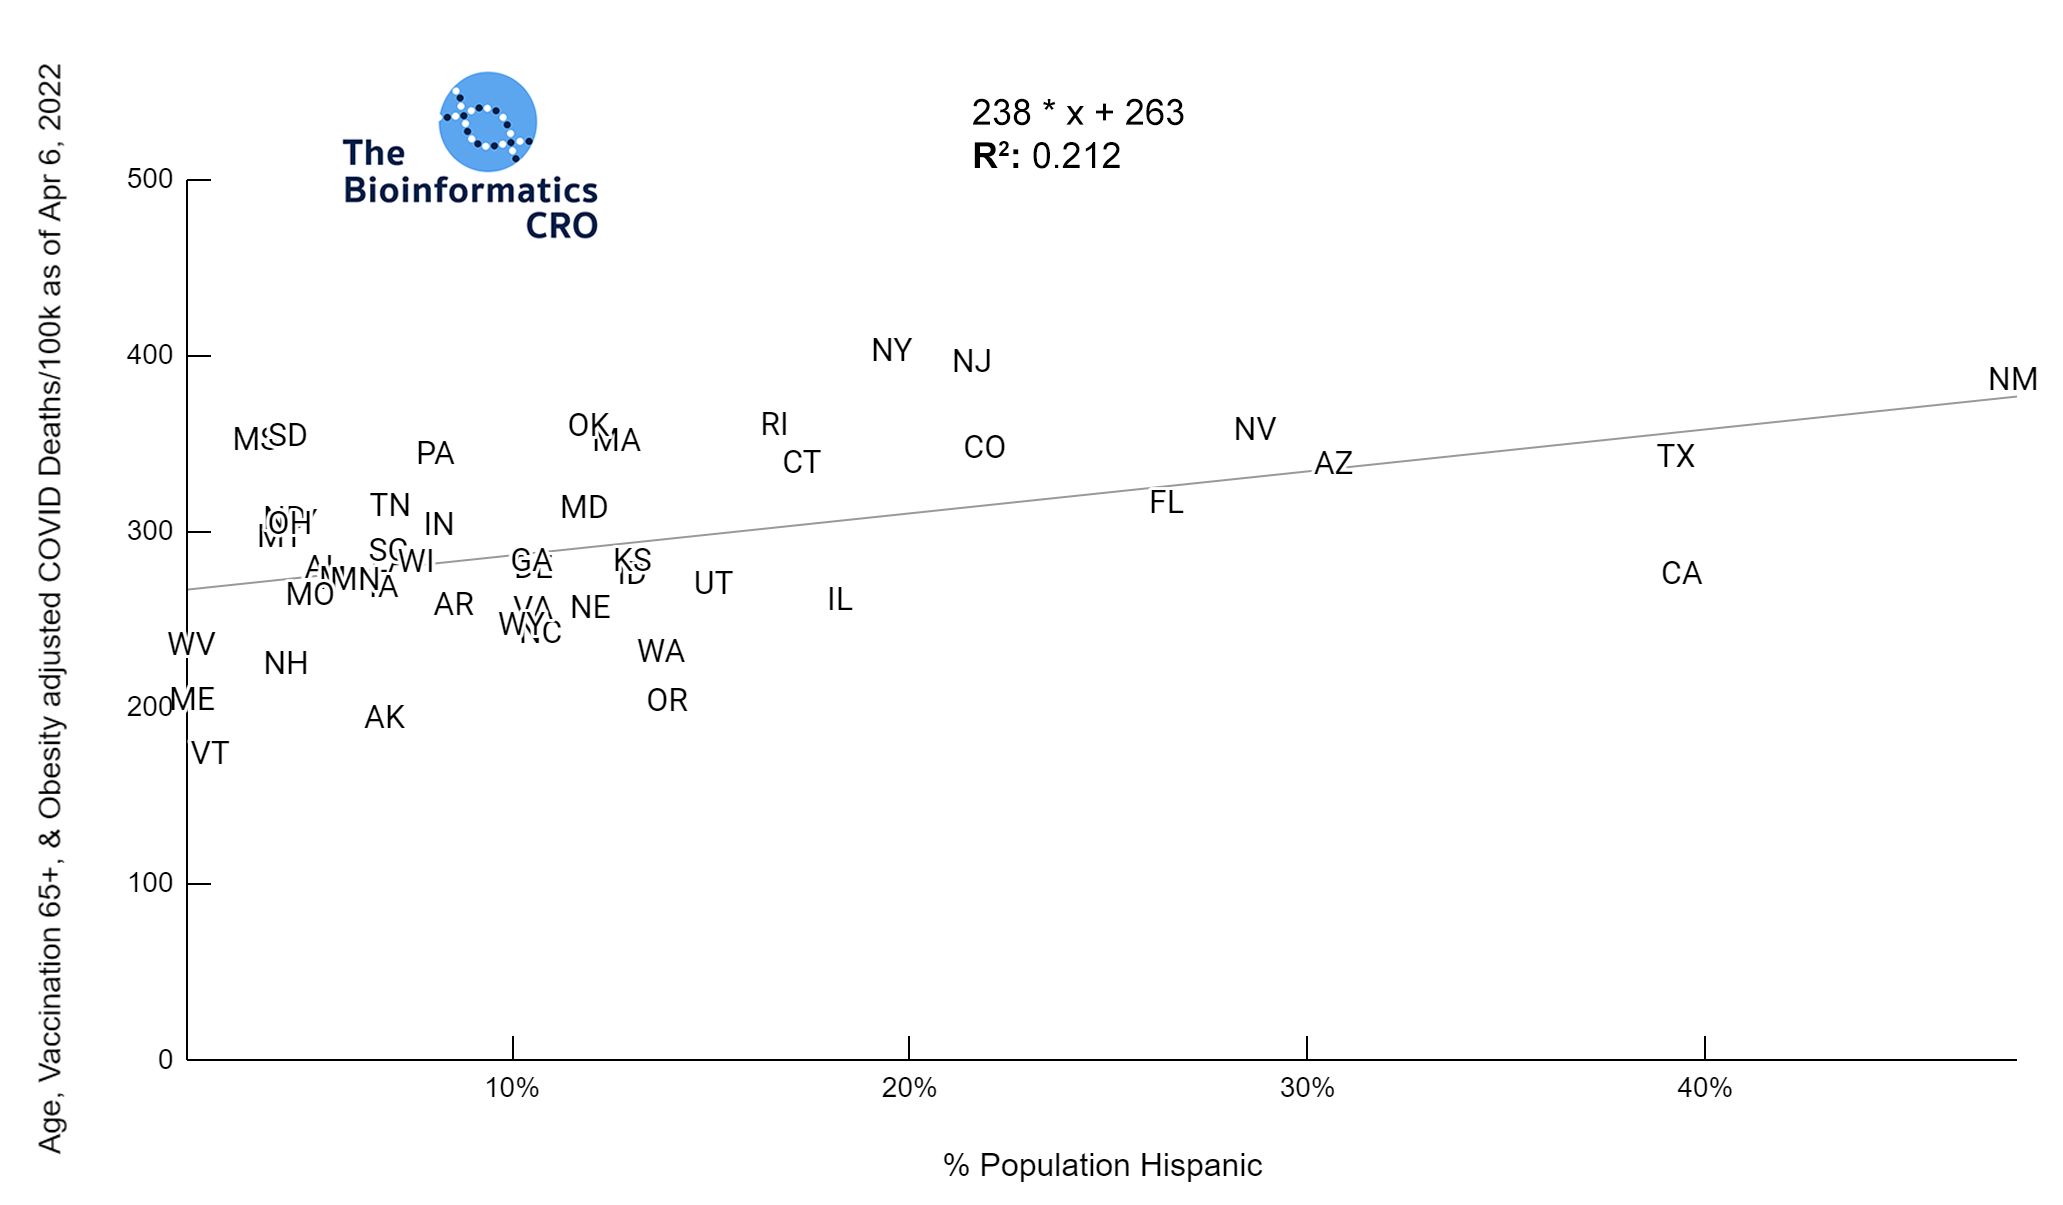
In a multiple regression model with obesity and vaccination over 65, % Hispanic population was significantly positively correlated with age adjusted deaths (P<0.05).
Mental Health
There are many new stresses associated with the pandemic that could lead to increases in mental illness in the population: worry about health, death of a loved one, chronic symptoms from long COVID, increased unemployment, and social isolation. All states observed an increase in depression and anxiety symptoms over the course of the pandemic and many had increases in suicides. However, based on our data these increases were not correlated with COVID deaths (depression & anxiety P=0.76, suicide P=0.12) or stringency index (depression & anxiety P=0.16, suicide P=0.28).
Age Adjusted COVID Deaths and % Change in Anxiety & Depressions Symptoms
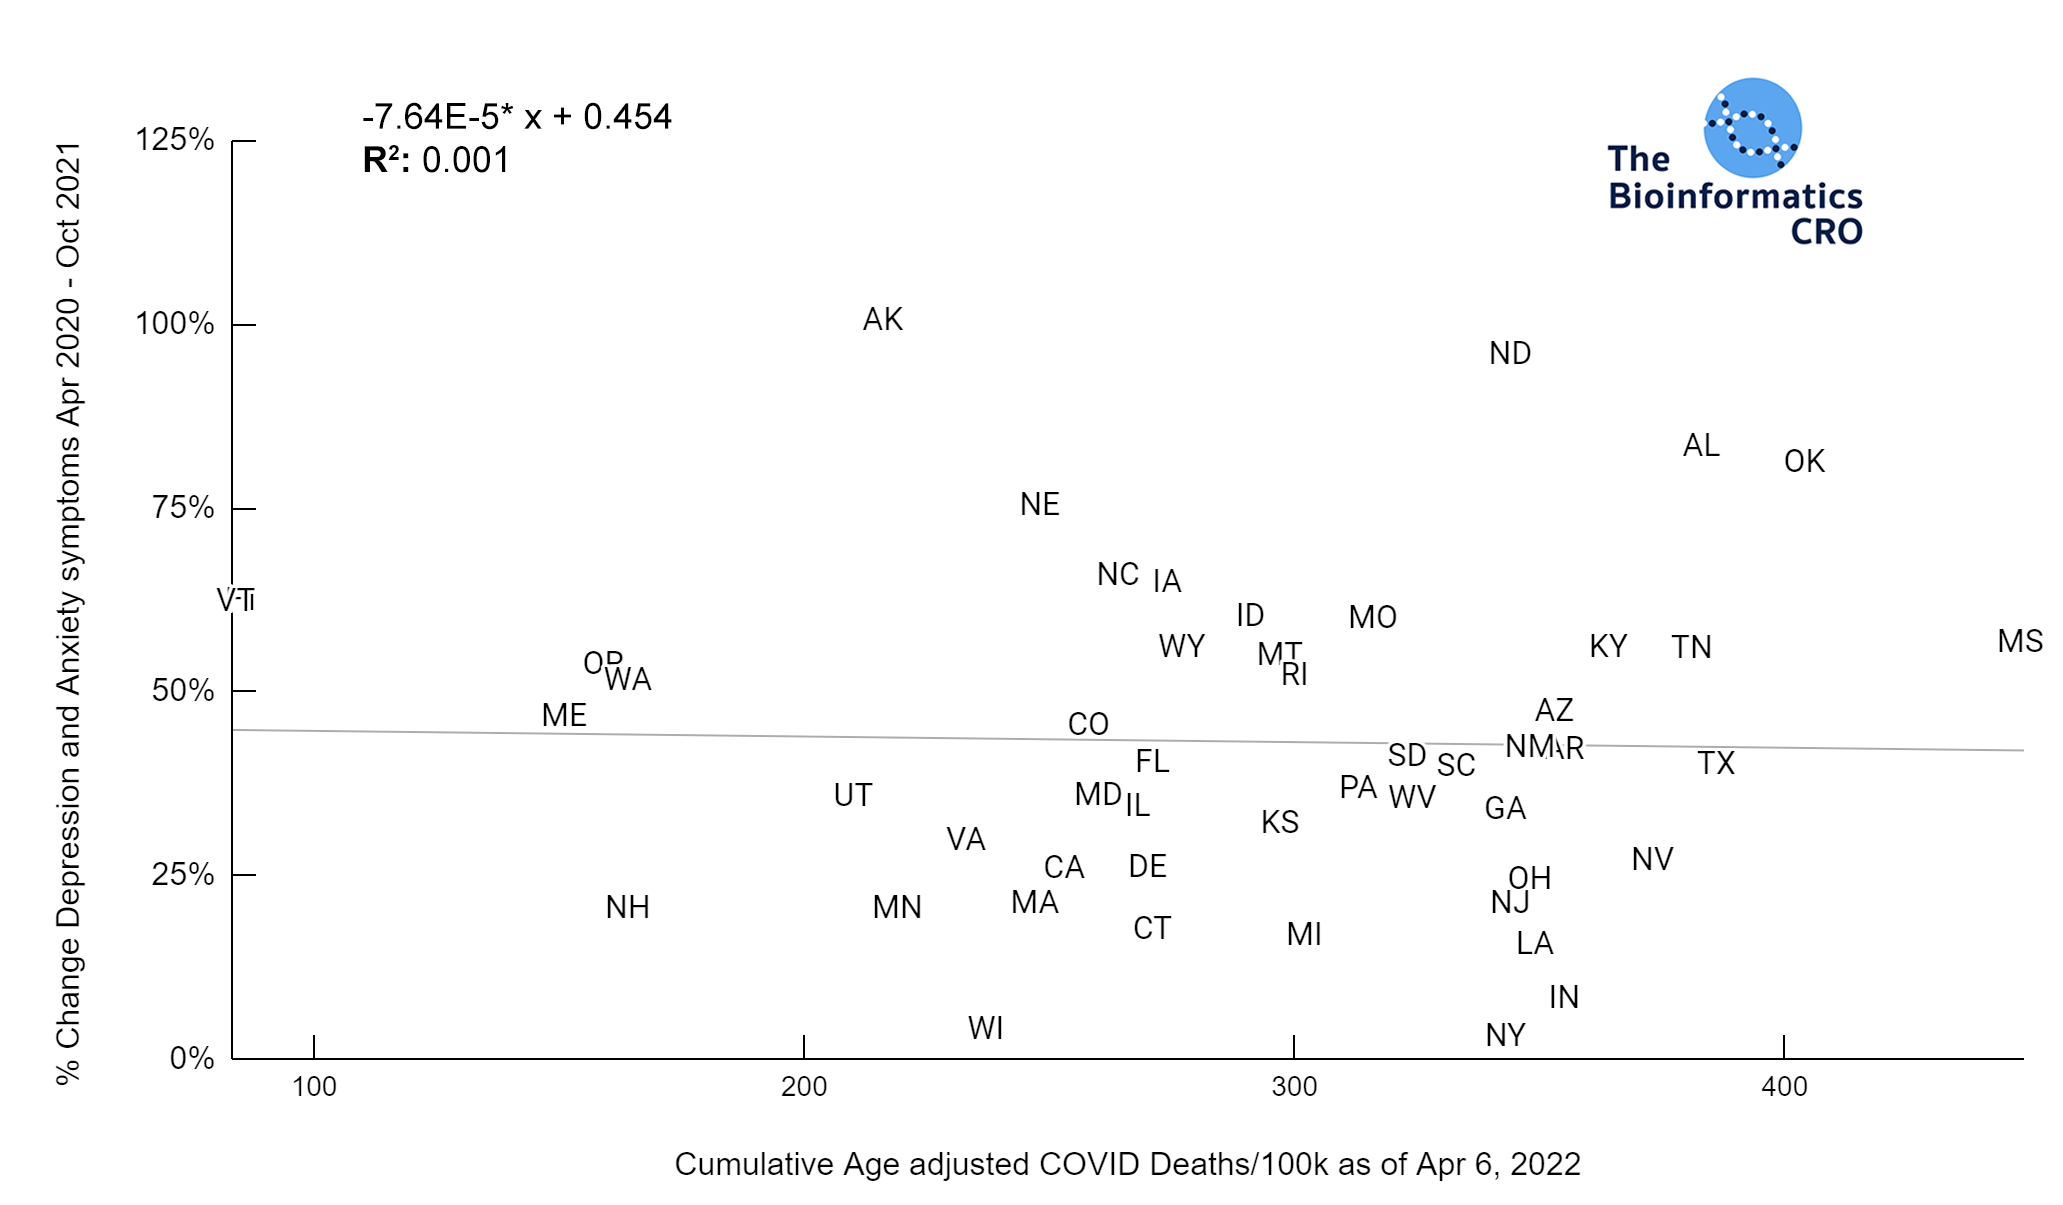
No Correlation P=0.76
Age Adjusted COVID Deaths and % Change in Suicide Mortality
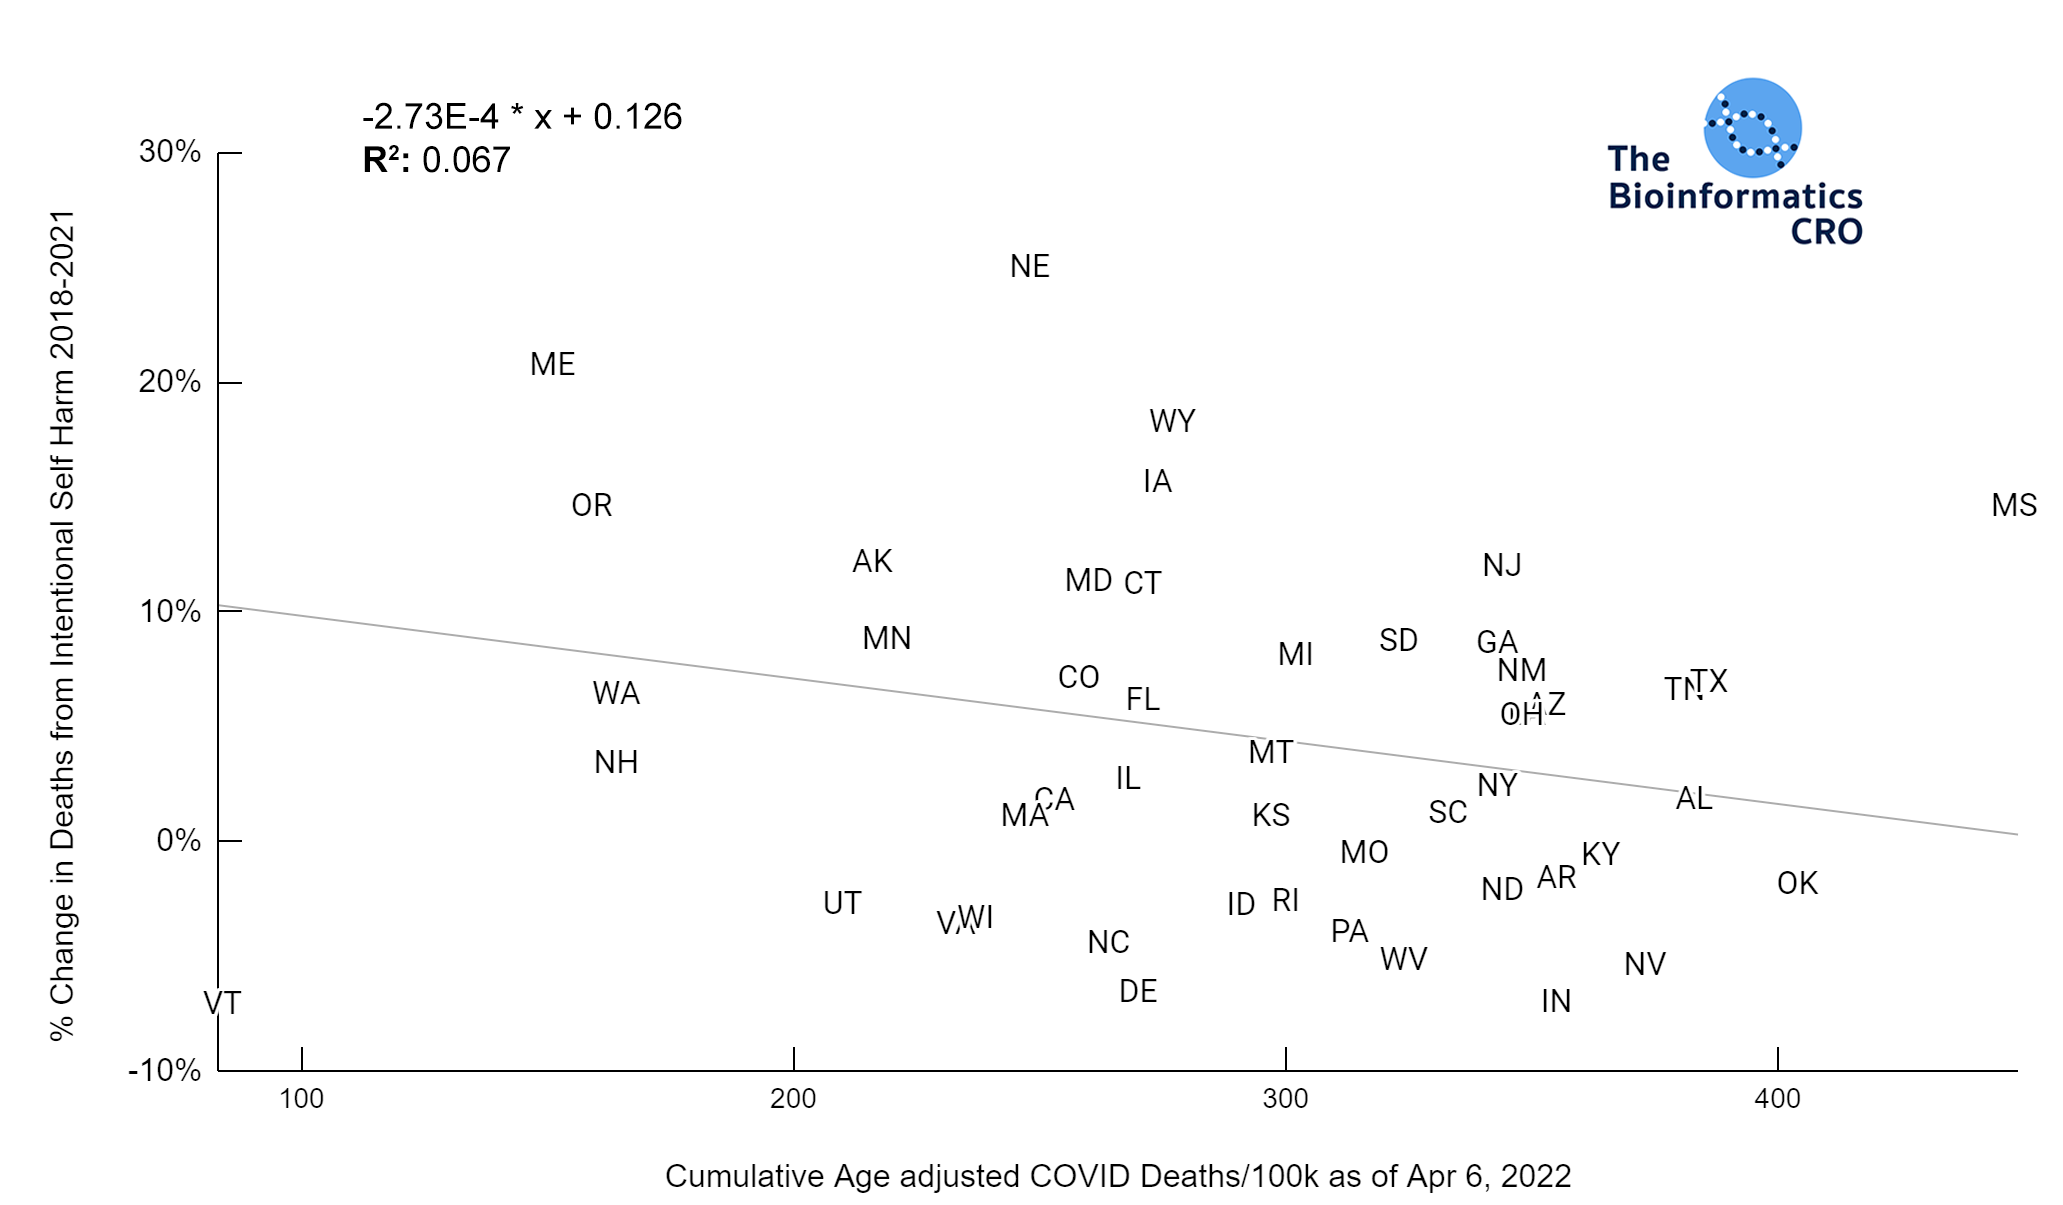
No Correlation P=0.12
% Change in Unemployment and % Change in Anxiety & Depressions Symptoms
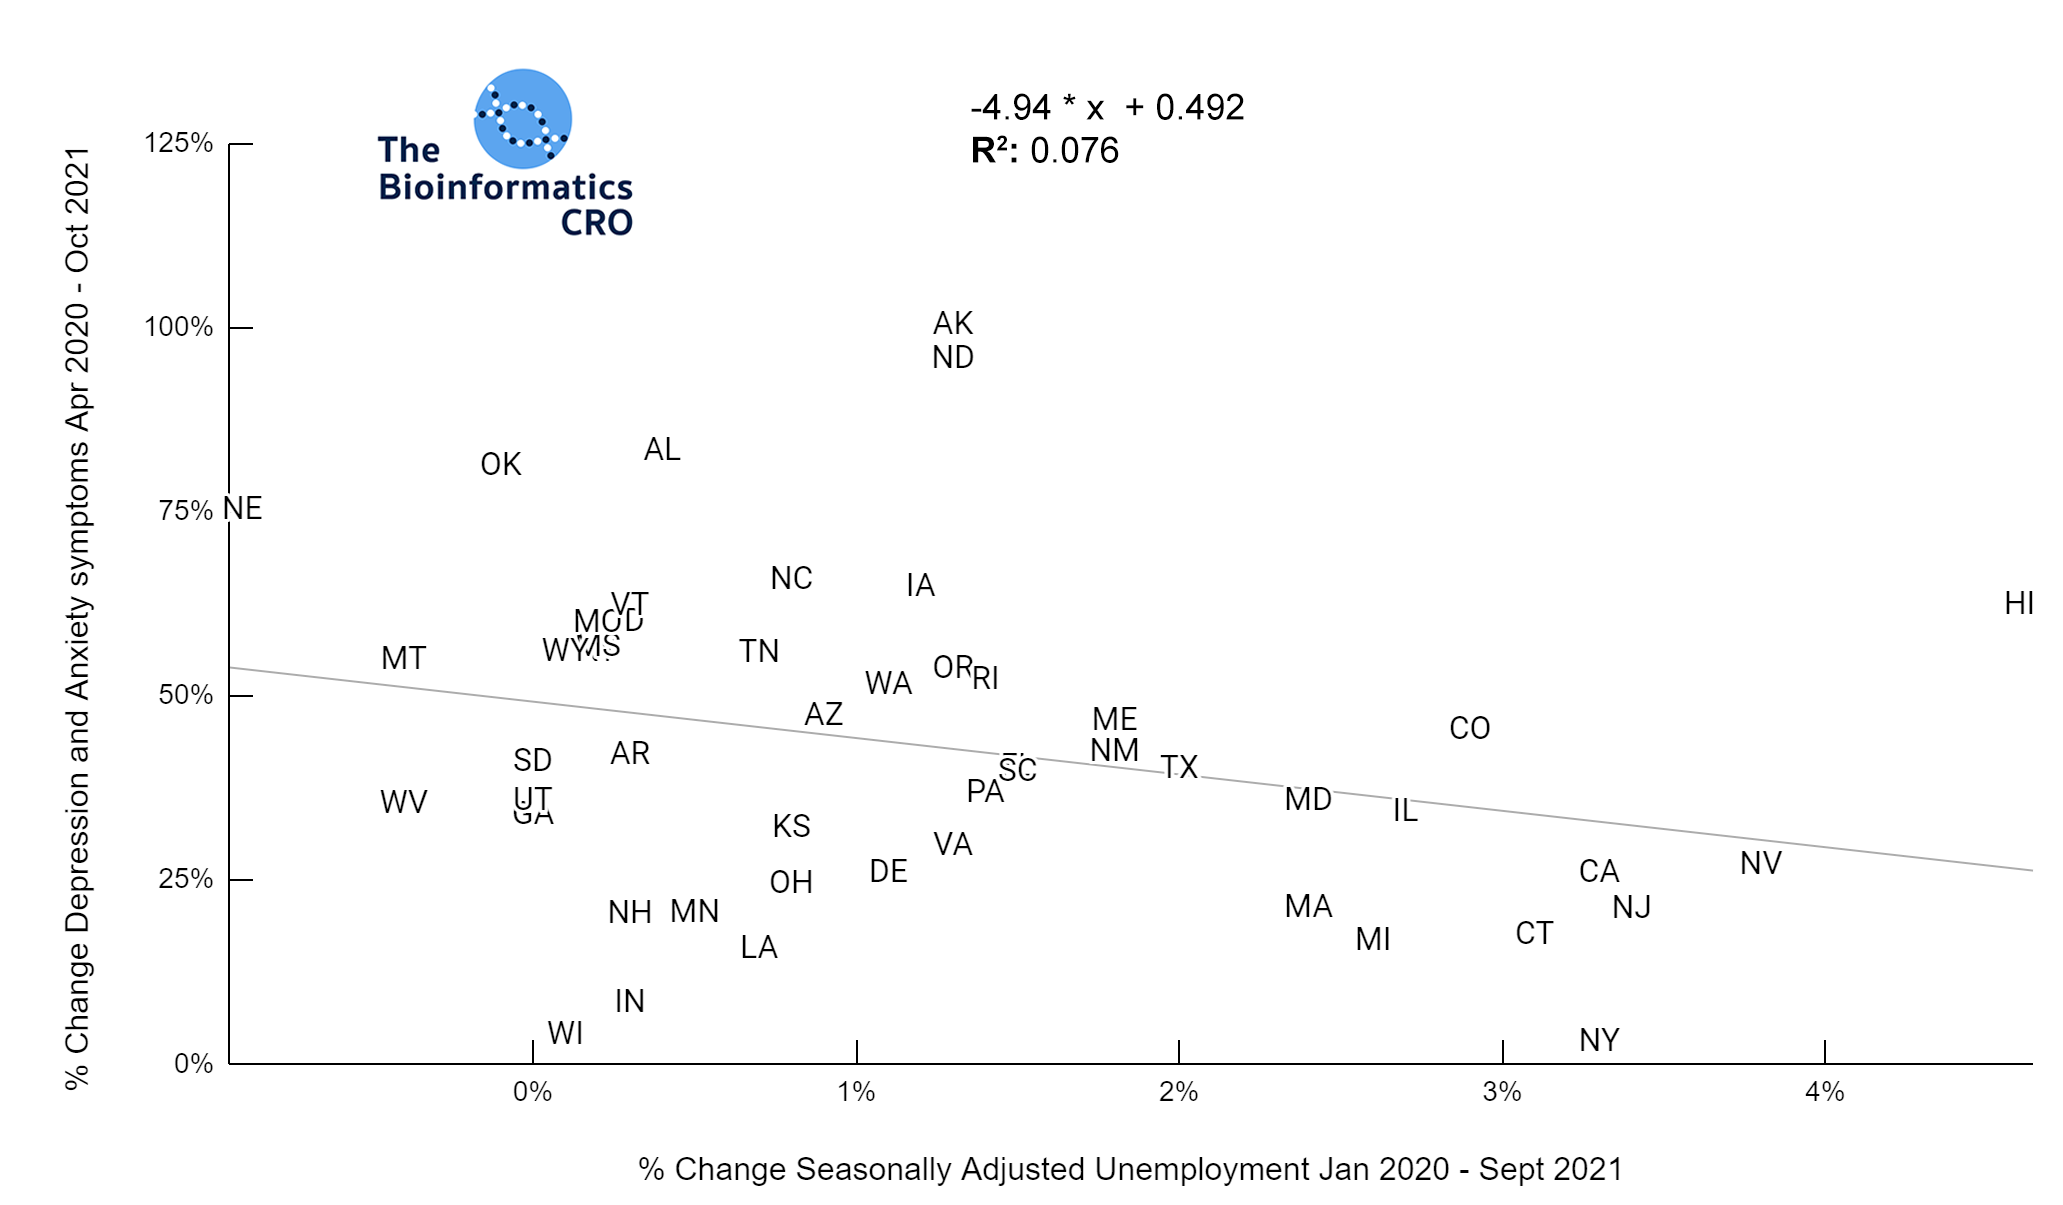
The chart to the left shows no significant correlation between anxiety and depression symptoms and the difference in seasonally adjusted unemployment from Jan 2020 to Sept 2021 (P=0.053)
Excess Deaths
Excess death is the difference between observed deaths in a specific time period and expected deaths in the same time period. The data below show the excess deaths in each state from Jan 2020 to Dec 2021. Expected deaths are based on historical trends from 6 years prior to the initial outbreak. The data below show a negative correlation between excess deaths and vaccination over 65 (P<0.01), which may be indicative that some deaths coded as non-COVID may in fact be related. For example, several studies have shown that even mild COVID infection significantly increases a person’s risk of cardiovascular disease. One found that the risk of stroke was 52% higher and heart failure was 72% higher in people who had been infected with COVID than those who had not.
Excess Deaths and Vaccination Rate
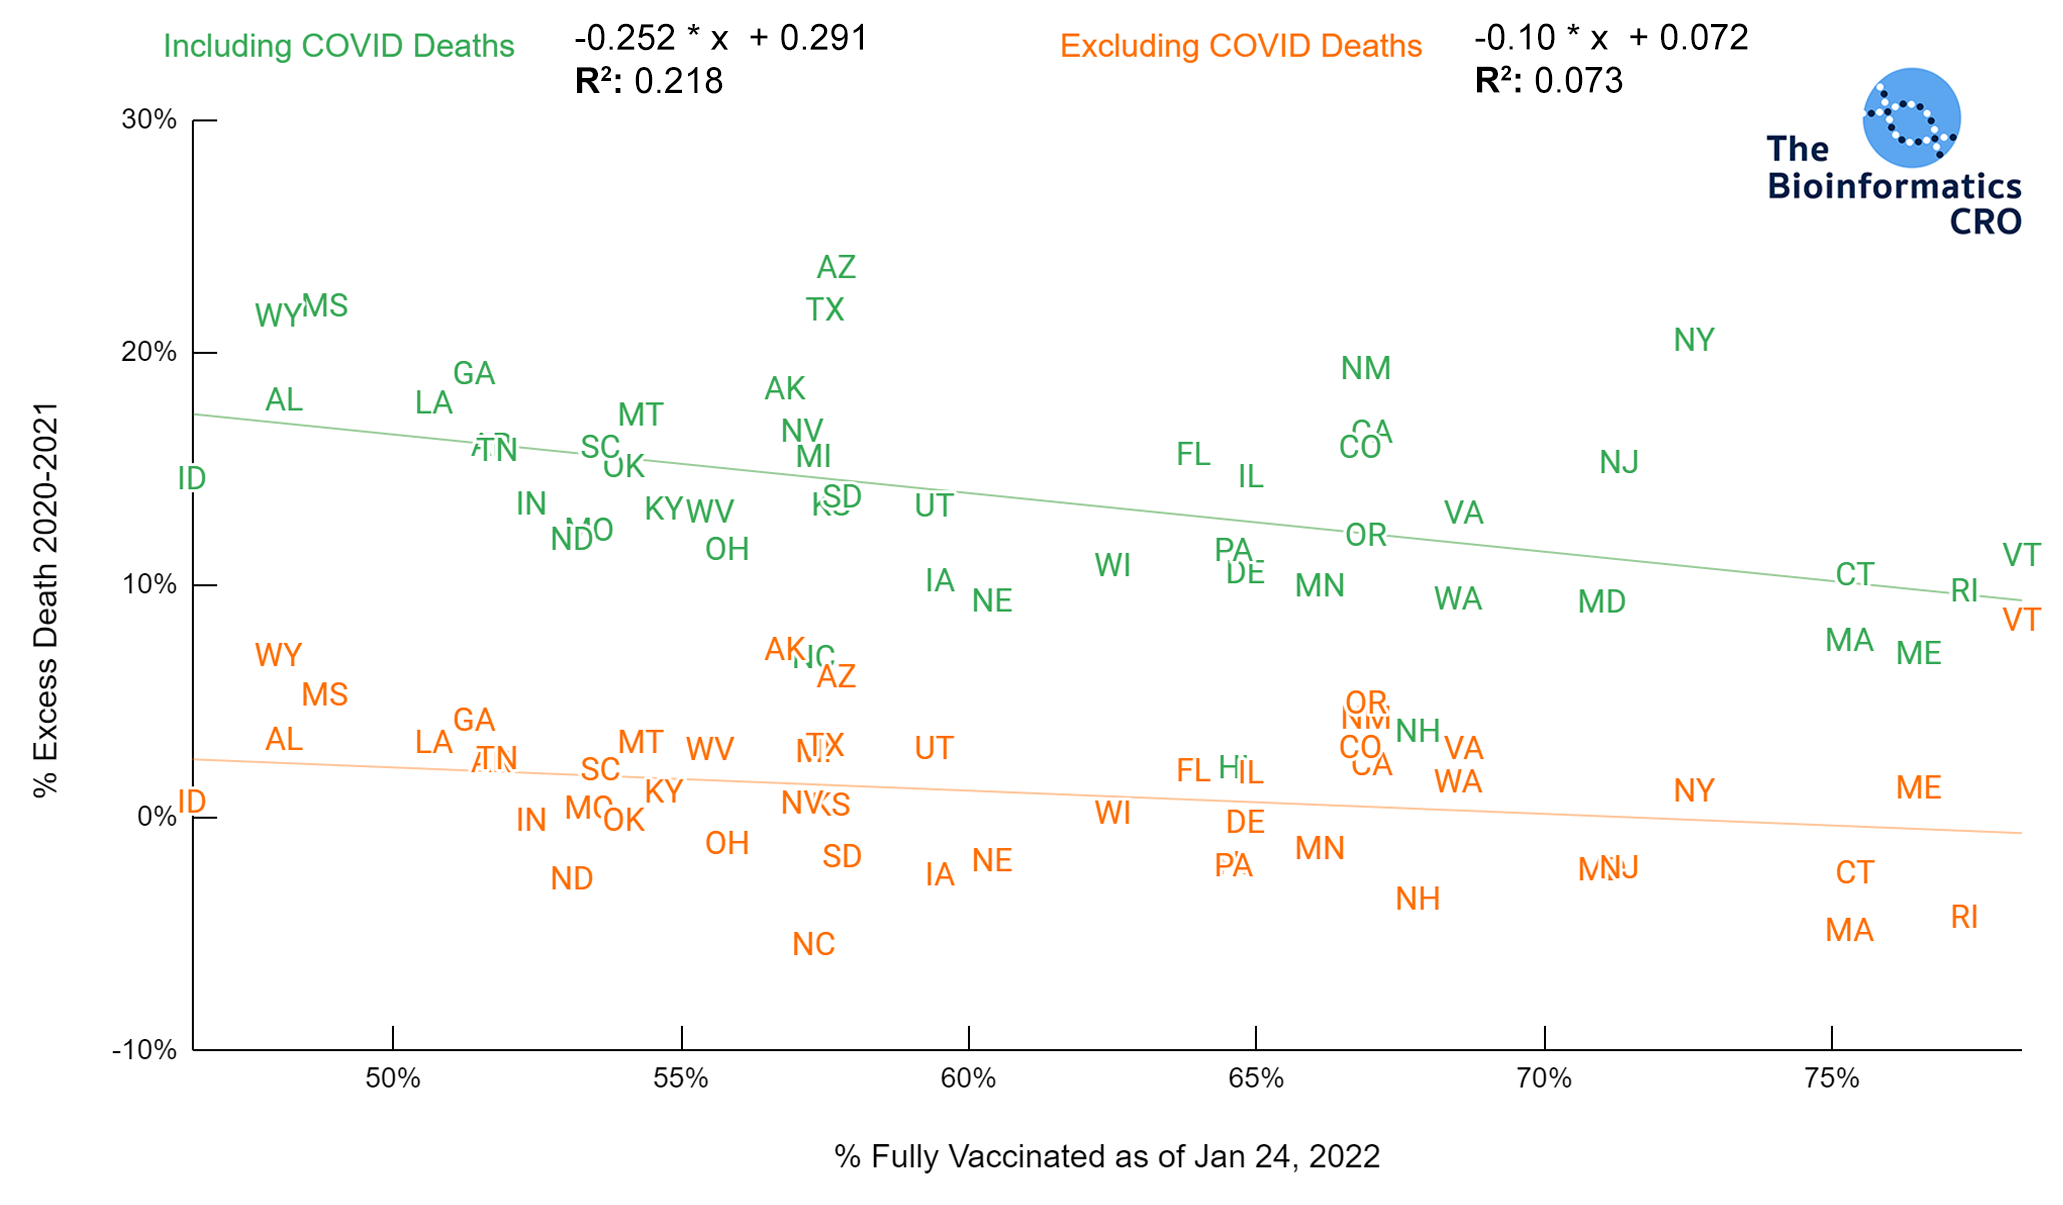
Including COVID Deaths: P<0.01 | Excluding COVID Deaths: P=0.057
Excess Deaths and Vaccination Rate 65+
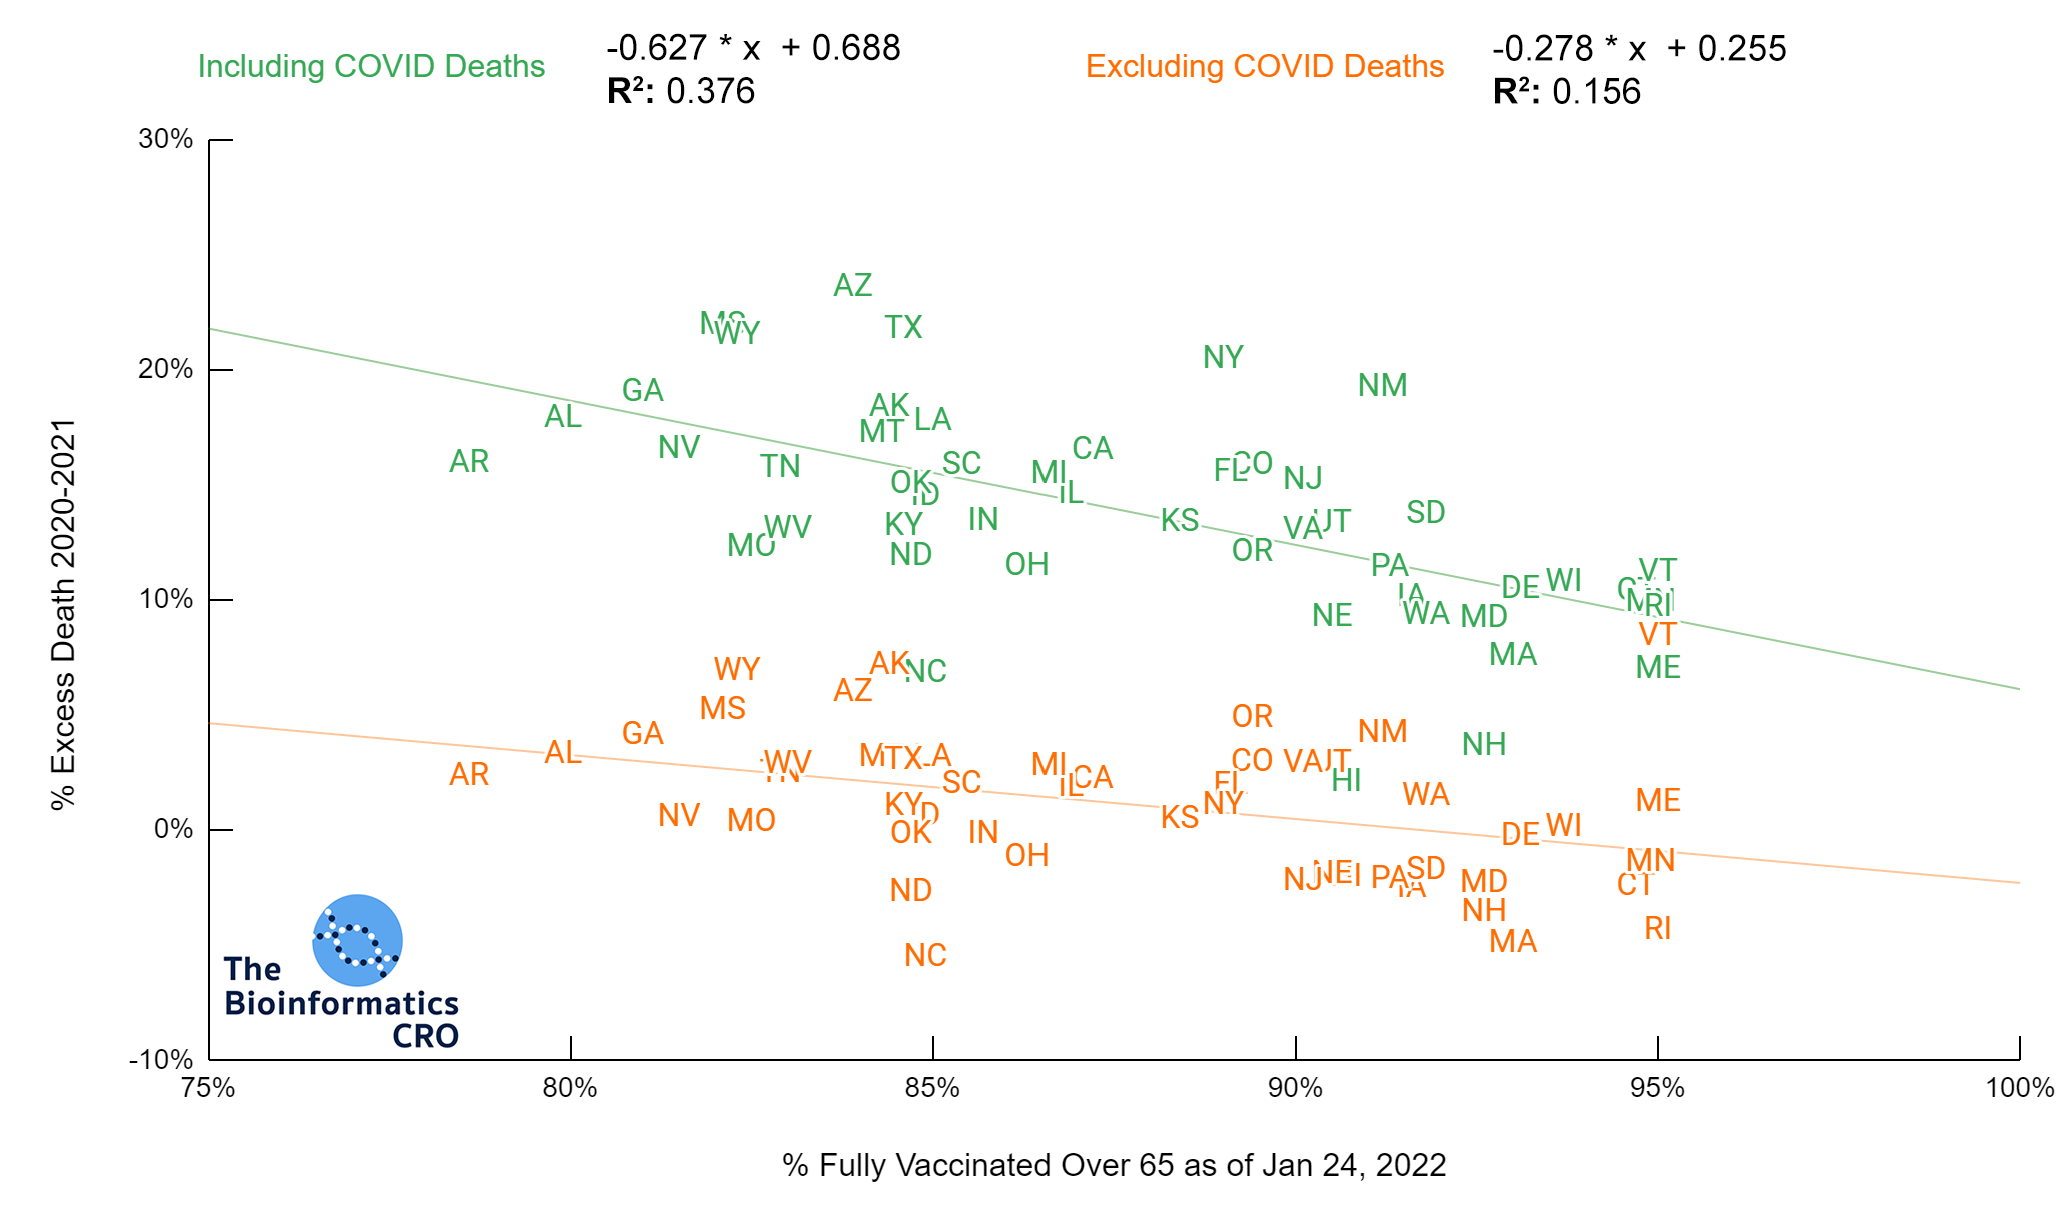
Including COVID Deaths: P<0.01 | Excluding COVID Deaths: P<0.01
Excess Deaths and Mean Stringency Index
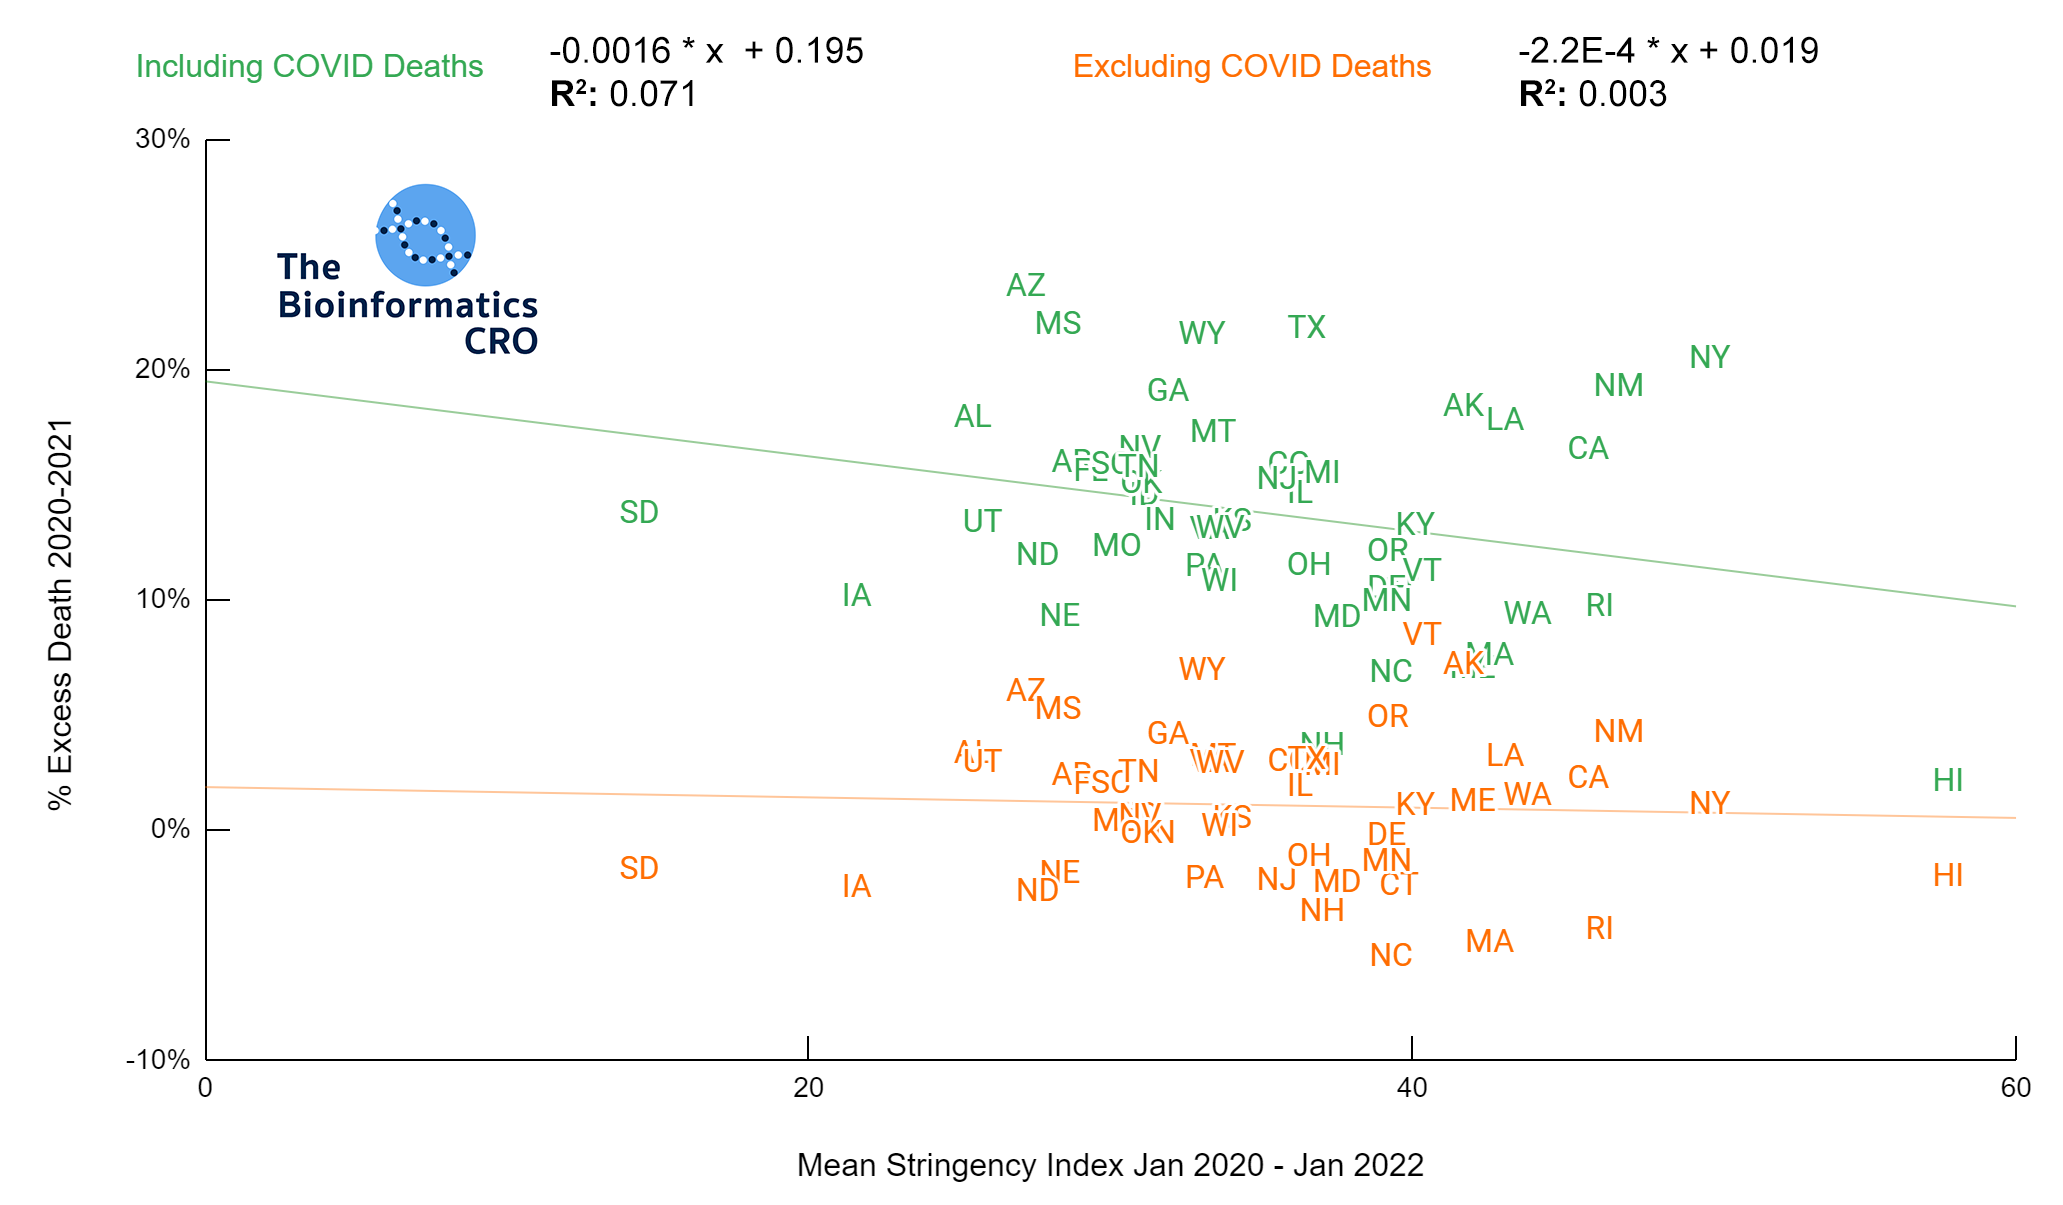
Including COVID Deaths: P=0.061 | Excluding COVID Deaths: P=0.71
Excess Deaths and Obesity
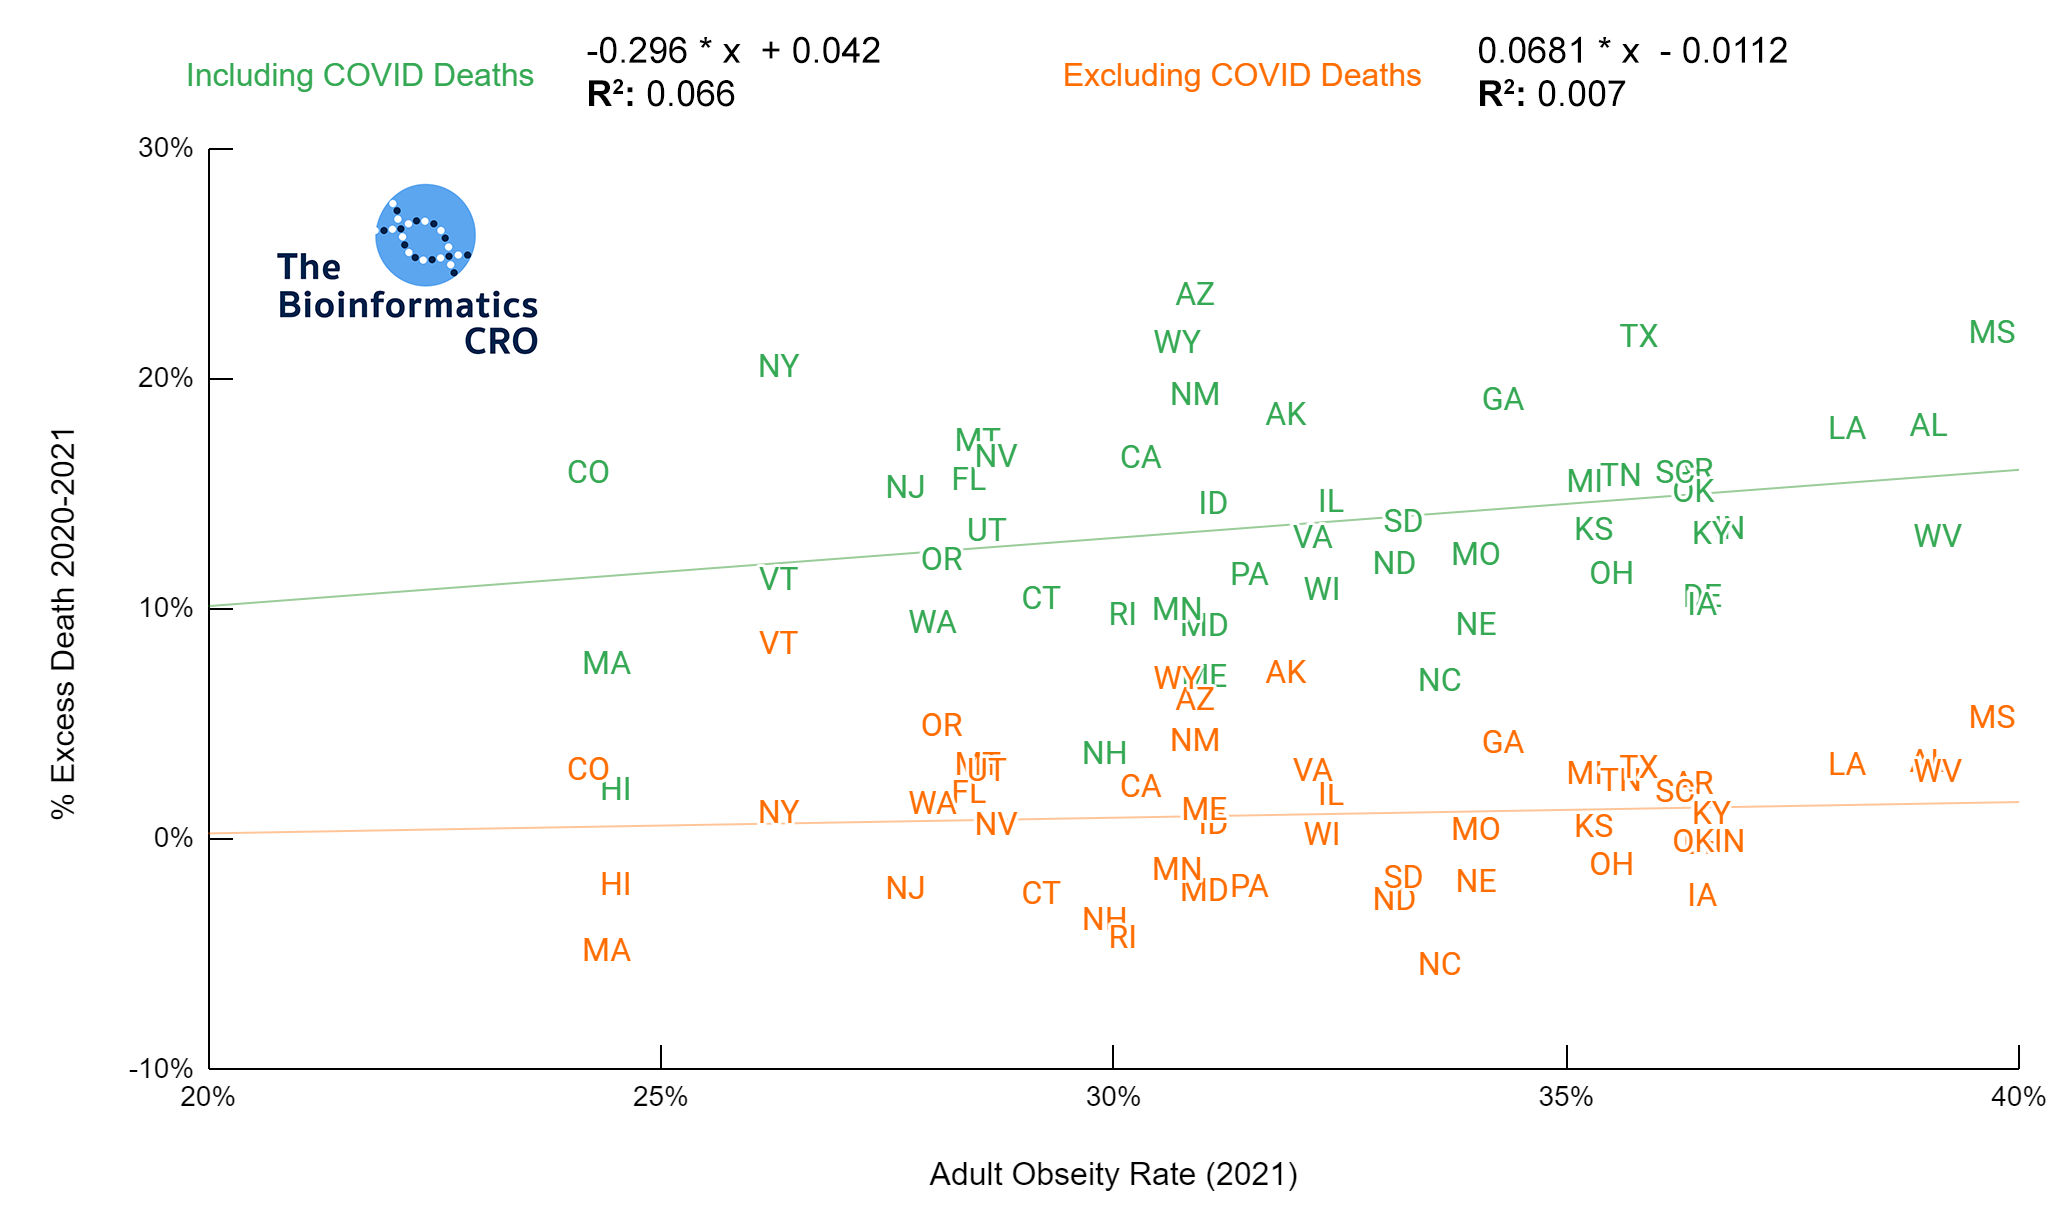
Including COVID Deaths: P=0.071 Excluding COVID Deaths: P=0.56
Notes on Methods
- P-values for plots were calculated using the Fisher R to Z transformation
- P-values for multivariate models were calculated by multiple regression
- Significance level was set at 0.05
Citations
- COVID deaths from CDC: “Provisional COVID-19 Death Counts by Sex, Age, and State” (From April 6, 2022)
- Population data from U.S. Census Bureau: “State Population by Characteristics: 2010-2019”
- State-level vaccination rate: “COVID-19 Vaccinations in the United States, Jurisdiction” (From April 11, 2022)
- Adult Obesity: “Adult Obesity Rates” (2020)
- Percent Trump Vote: “Presidential Results” (2020)
- Seasonally Adjusted Unemployment Rates: “Unemployment Rate” (October 2021)
- Race and Ethnicity: “US Census” (2017)
- Stringency Index: “OXCGRT US COVID Policy” (From March 2022)
- Gini Index: “Household Income: 2019”(Published September 2020)
- Anxiety and Depression: “Indicators of Anxiety or Depression Based on Reported Frequency of Symptoms During Last 7 Days” (Apr 2020 and Oct 2021)
- US Suicide Mortality: “America’s Health Rankings: Suicides” (2018 and 2021)
- Excess Deaths: “Excess Deaths Associated with COVID-19” (2020-2021)