States Ranked by Age-Adjusted COVID Deaths
Data updated on December 7, 2022
We’re inundated with statistics on how US states have fared relative to one another throughout the pandemic. Sometimes these can appear contradictory because the data can be cut to support a variety of narratives. We wanted an updated source of cumulative age-adjusted COVID-19 deaths by state, as death is an important measure of the impact of a pandemic, and states have adopted widely divergent policies.
While COVID-19 deaths are usually adjusted for state population (deaths per 100,000), they are usually not adjusted for the age distribution of a state. It’s important to adjust for age when considering state-to-state differences in outcomes as age is the dominant risk factor for death provided someone is infected with COVID, and state age distributions vary considerably. In the following analysis, we present age-adjusted cumulative COVID-19 deaths and rank each state plus Puerto Rico and the District of Columbia accordingly. We generated the plot and table using the CDC’s Provisional COVID-19 Death Counts by Sex, Age, and State database, which sourced its data from death certificates. These numbers are more consistently processed across states, though they may differ slightly from other sources.
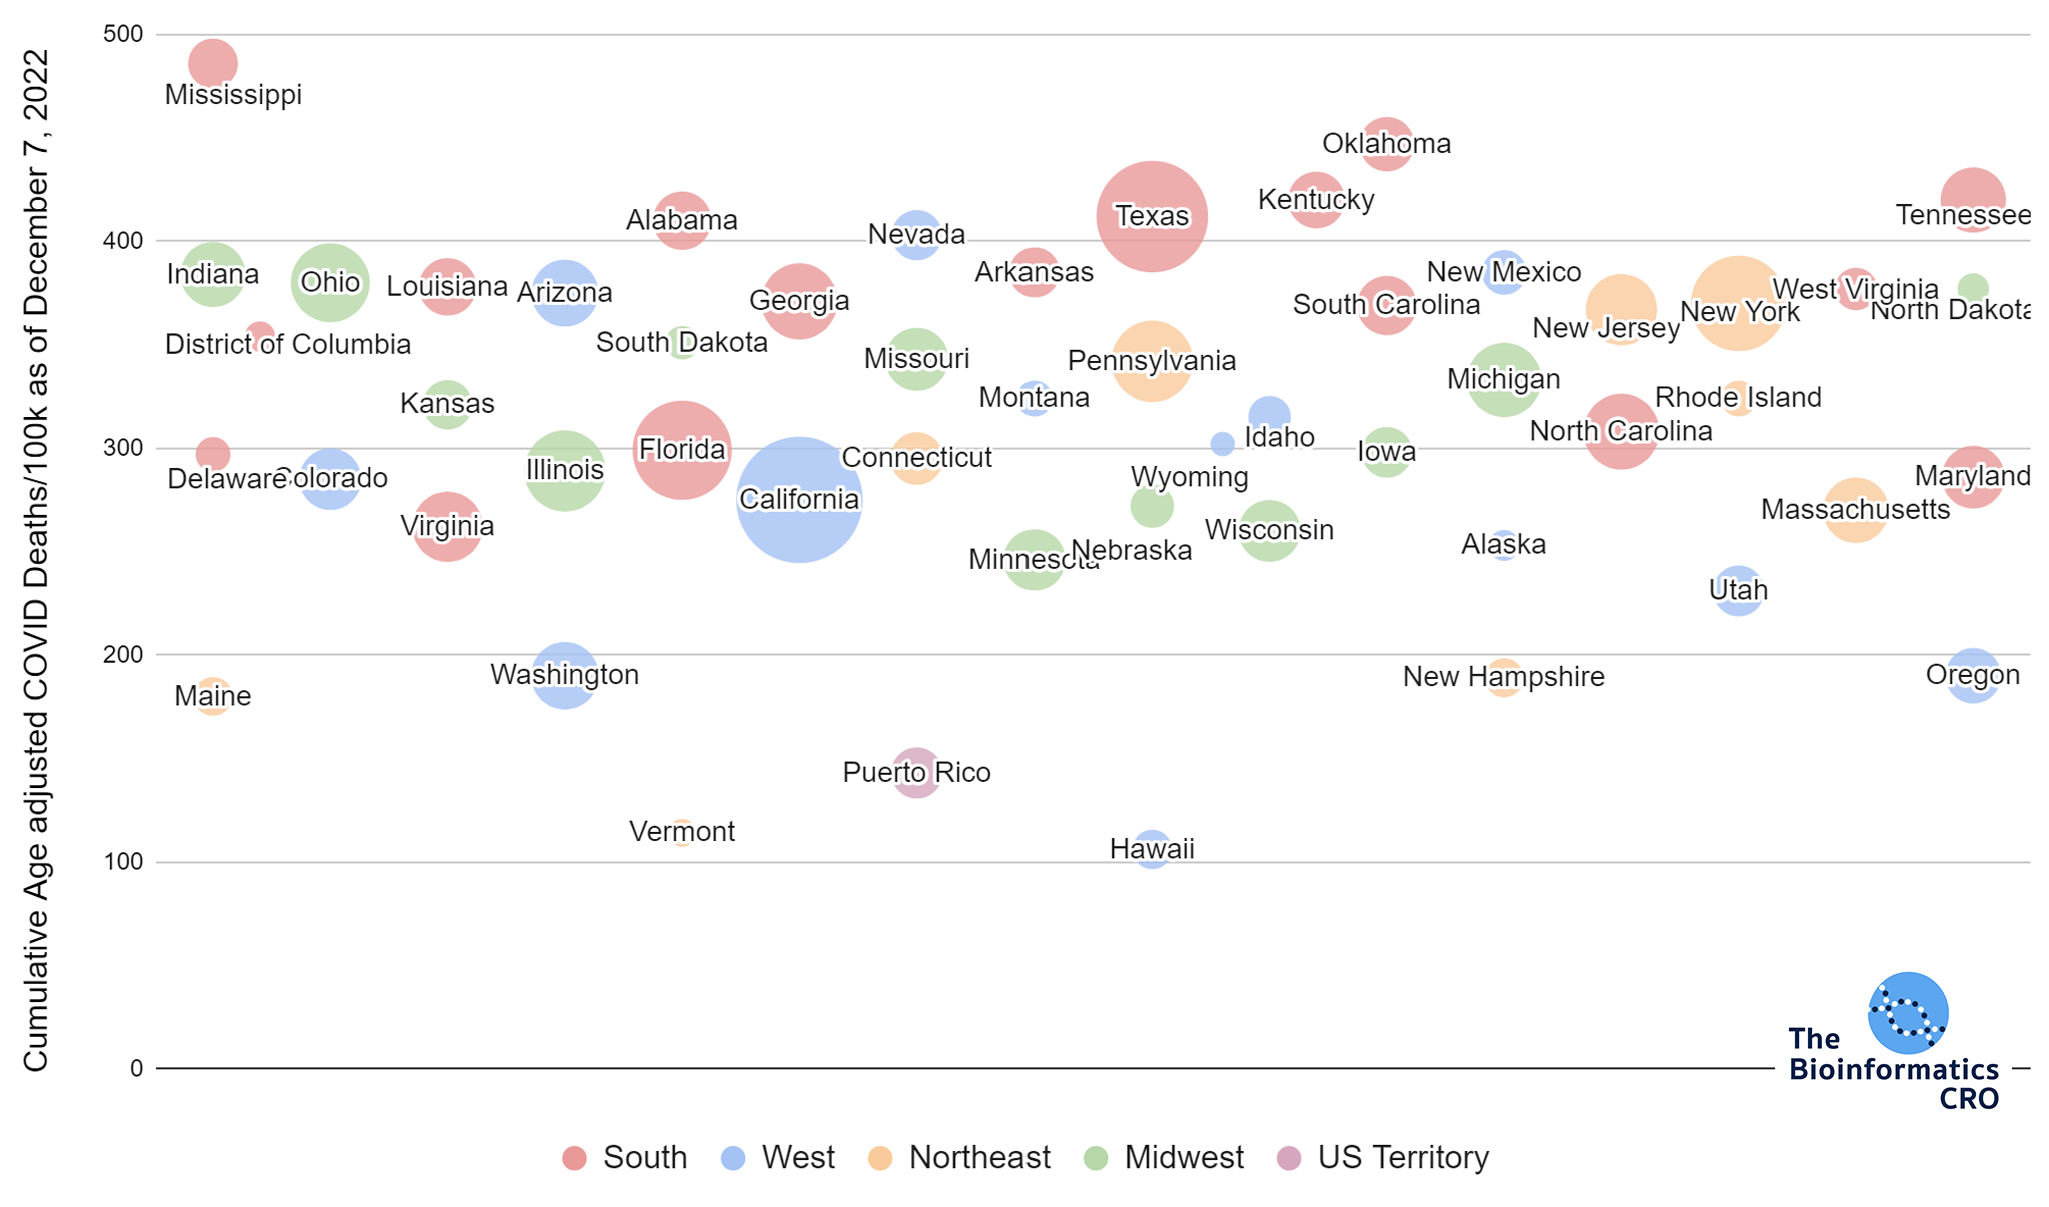
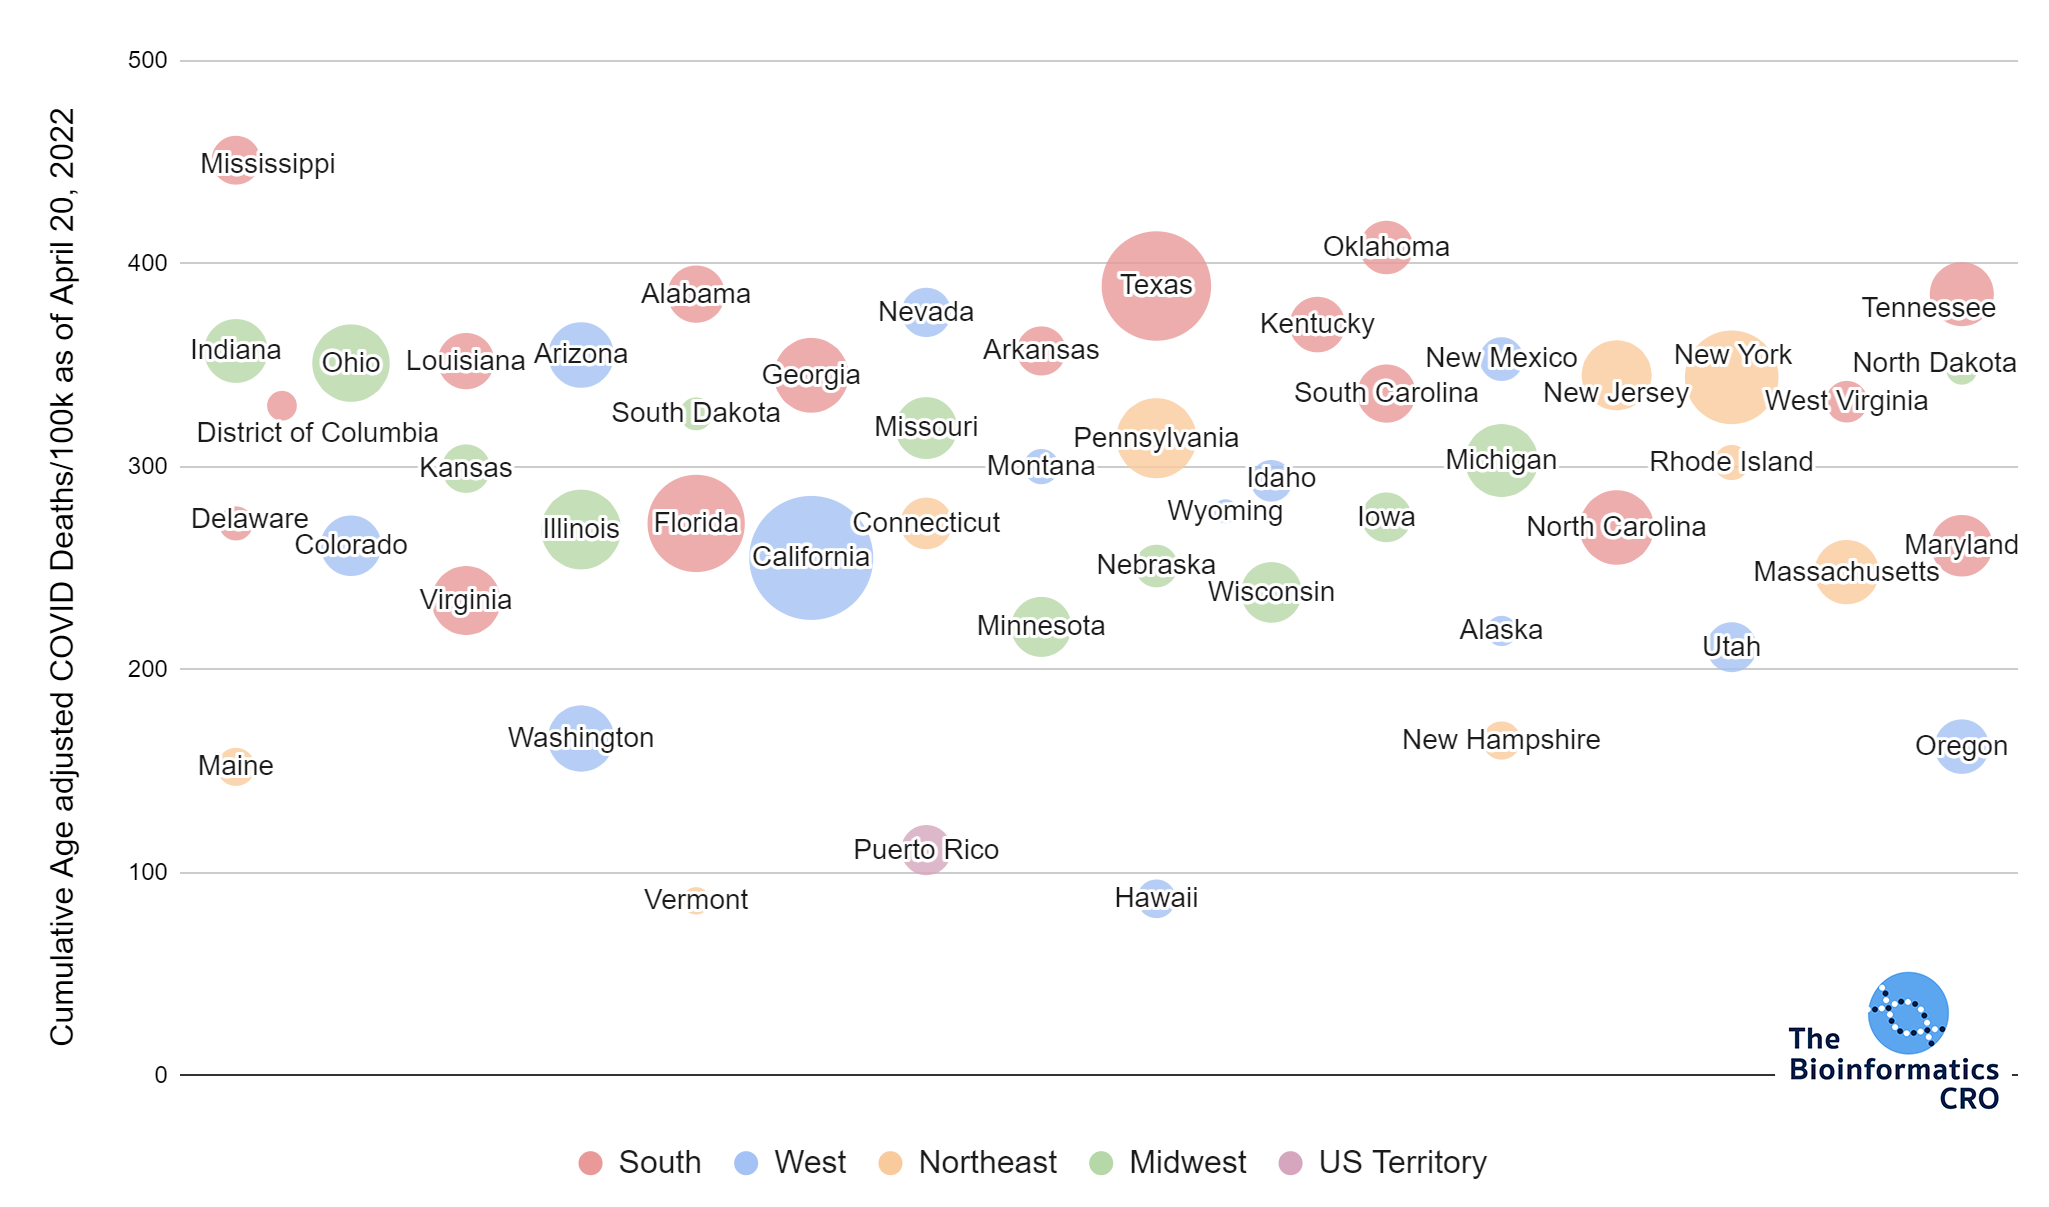
Bubble areas are proportional to state populations and the horizontal arrangement is arbitrary to reduce overlap.
Here we see dramatic state-to-state differences in cumulative age-adjusted COVID deaths per capita to date, spanning a range of over five fold. In the end, some states that adopted dramatically divergent policies had comparable outcomes (Florida and California, for example).
Mississippi is exceptionally high. A few regional clusters have fared markedly better than the rest: Vermont, New Hampshire & Maine, Oregon & Washington, and Hawaii & Puerto Rico.
Why do COVID deaths vary by state?
Explore the relationships between age-adjusted COVID deaths and several state-level metrics including: vaccination coverage, obesity rate, the strictness of COVID policy and more.
Age-Adjusted COVID Deaths Ranking |
State |
COVID-19 Deaths per 100,000 |
Age-Adjusted COVID-19 Deaths per 100,000 |
| 1 | Mississippi | 474 | 486 |
| 2 | Oklahoma | 438 | 447 |
| 3 | Kentucky | 416 | 420 |
| 3 | Tennessee | 415 | 420 |
| 5 | Texas | 344 | 412 |
| 6 | Alabama | 417 | 410 |
| 7 | Nevada | 379 | 403 |
| 8 | Arkansas | 397 | 385 |
| 8 | New Mexico | 399 | 385 |
| 10 | Indiana | 377 | 384 |
| 11 | Ohio | 399 | 380 |
| 12 | Louisiana | 363 | 378 |
| 13 | North Dakota | 388 | 377 |
| 13 | West Virginia | 430 | 377 |
| 15 | Arizona | 394 | 375 |
| 16 | Georgia | 325 | 371 |
| 17 | New York | 391 | 370 |
| 18 | South Carolina | 378 | 369 |
| 19 | New Jersey | 381 | 367 |
| 20 | District of Columbia | 300 | 354 |
| 21 | South Dakota | 371 | 351 |
| 22 | Missouri | 359 | 343 |
| 23 | Pennsylvania | 389 | 342 |
| 24 | Michigan | 349 | 333 |
| 25 | Montana | 353 | 324 |
| 25 | Rhode Island | 363 | 324 |
| 27 | Kansas | 327 | 321 |
| 28 | Idaho | 299 | 315 |
| 29 | North Carolina | 303 | 308 |
| 30 | Wyoming | 301 | 302 |
| 31 | Florida | 357 | 299 |
| 32 | Iowa | 327 | 298 |
| 33 | Delaware | 326 | 297 |
| 34 | Connecticut | 330 | 295 |
| 35 | Illinois | 289 | 289 |
| 36 | Maryland | 278 | 286 |
| 37 | Colorado | 250 | 285 |
| 38 | California | 258 | 275 |
| 39 | Nebraska | 276 | 272 |
| 40 | Massachusetts | 287 | 270 |
| 41 | Virginia | 251 | 262 |
| 42 | Wisconsin | 273 | 260 |
| 43 | Alaska | 192 | 253 |
| 44 | Minnesota | 250 | 246 |
| 45 | Utah | 173 | 231 |
| 46 | Oregon | 197 | 190 |
| 46 | Washington | 179 | 190 |
| 48 | New Hampshire | 205 | 189 |
| 49 | Maine | 215 | 180 |
| 50 | Puerto Rico | 167 | 143 |
| 51 | Vermont | 130 | 114 |
| 52 | Hawaii | 120 | 106 |
Calculation
We determined the age adjusted mortality per 100,000 people (maa) for each state using the formula:
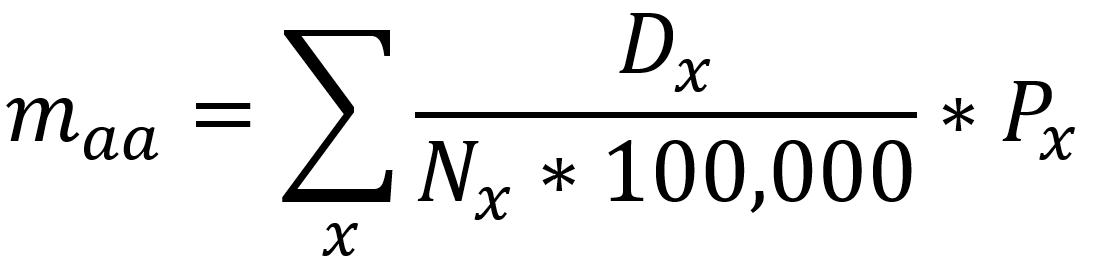
Where Dx is the total deaths in age group x in the state, Nx is the total population in age group x in the state, and Px is the percent of the population in age group x in the United States.
Citations
COVID deaths from CDC: “Provisional COVID-19 Death Counts by Sex, Age, and State” (Updated on December 7, 2022)
Population data from U.S. Census Bureau: “State Population by Characteristics: 2010-2019”